Have a question?
How much is a ton of carbon dioxide?
In 2022, humans emitted more than 40 billion tons of carbon dioxide (CO2) into the atmosphere by burning fossil fuels. It can be difficult to picture a “ton” of a gas like CO2, so let’s describe it in a few different ways.
Updated December 21, 2023
Imagine a cube 27 feet tall, wide, and long. But just in case that’s a little hard to picture, imagine a cube almost as tall, wide, and long as a telephone pole. That’s how much space it would take to hold a metric ton of CO2.1 (We’re going to talk in metric tons here, because that’s how scientists measure CO2. A metric ton is 2,204.6 lbs, and is a little bigger than the American ton’s 2,000 lbs and a little smaller than the British ton’s 2,240 lbs —but the three are fairly comparable.)
And remember, this is literally a ton. While it may not seem like a gas can weigh that much, this 27’ x 27’ x 27’ cube has the same weight as a great white shark or, well, a ton of bricks (400 bricks!)
The average American produces enough CO2 each year to fill 15 of these enormous cubes.2 This many cubes can fill over three Olympic-sized swimming pools. The Earth is able to reabsorb a lot of that CO2 through trees, oceans, and other natural processes. But much of it will stay in the atmosphere, potentially for hundreds of years.
That’s a lot of cubes. So how are we making all of this CO2?
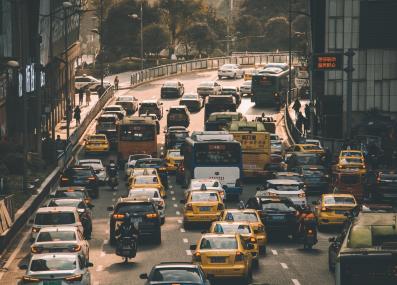
Let’s start with some activities you’re probably very familiar with. The U.S. EPA has found that a typical 22 MPG gas-based car emits about 4.6 tons of carbon dioxide per year.3 On average, you emit one ton of CO2 for about every 2,500 miles you drive—about the distance from Boston, Massachusetts to Salt Lake City, Utah.
Airplanes emit much more CO2 than cars, but they also carry more people. A 3,000-mile round-trip flight (like one from Boston to London and back) emits approximately one ton of CO2 per passenger.4 About 3 million people fly every day in and out of U.S. airports,5 so you can imagine how quickly that adds up.
Not all of the CO2 we emit is as visible as the exhaust from our tailpipes. One University of Michigan study found that for the average American, the food we eat accounts for close to two tons of CO2 emissions a year.6 Those emissions come from the animals and plants we grow for food, the transportation of food in carbon-emitting trucks and ships, and the greenhouse gases emitted when uneaten food decomposes.
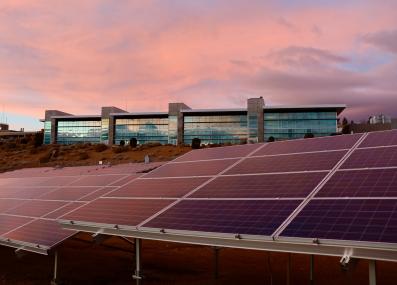
We can also think about the CO2 emissions we avoid by changing our behaviors. The U.S. Department of Energy estimates that switching from a gas car to an electric one reduces emissions, on average, to just 22% as much CO2 per year.7 In other words, you can drive 9,250 miles before emitting one ton of CO2—about the same as driving from Miami, Florida to Sydney, Australia (assuming you have a car that can drive on water).
If you’re curious how much CO2 other everyday activities create, the EPA has a household carbon footprint calculator.
Most of the CO2 humans emit doesn’t come from everyday activities like driving. In fact, when we say that the average American emits 15 tons of CO2 a year, most of this isn’t from our direct emissions. Instead, it’s from large-scale processes, like making electricity or manufacturing products and building materials, which are averaged across the whole population. For example, the World Steel Association estimates that, for every ton of steel we produce, almost two tons of CO2 are added to the atmosphere.8
And while it’s nice to know what one ton of carbon looks like, what about 40 billion tons of CO2—roughly the amount the whole human race emits every year?2 40 billion 27’ x 27’ x 27’ cubes would cover 1,045,911 square miles. This is enough to completely cover Alaska, Texas and California, America’s three largest states, to a depth of 27 feet. In the continental U.S., it would cover the entire Southwest—California, Nevada, Utah, Colorado, New Mexico, Arizona, and Texas—with room to spare for nearby Wyoming. And that’s just one year of the world’s CO2 emissions.
Submit your own question to Ask MIT Climate
Get the latest from Ask MIT Climate monthly in your inbox
1 Millennium ART led an international art exhibit at the United Nations Climate Change Conference in Copenhagen in December 2009, featuring 27’ x 27’ x 27’ cubes representing a metric ton of CO2.
2 Friedlingstein, Pierre, et al. "Global Carbon Budget 2023." Earth System Science Data, Volume 15, Issue 12, 2023. doi:10.5194/essd-15-5301-2023.
3 U.S. Environmental Protection Agency, Greenhouse Gas Emissions from a Typical Passenger Vehicle. Accessed December 21, 2023.
4 U.S. Environmental Protection Agency, Emission Factors for Greenhouse Gas Inventories. Accessed December 21, 2023.
5 U.S. Federal Aviation Administration, Air Traffic By The Numbers. Accessed December 21, 2023.
6 Heller, Martin C., et al. "Greenhouse gas emissions and energy use associated with production of individual self-selected US diets." Environmental Research Letters, vol. 13, no. 4, 2018.
7 U.S. Department of Energy Alternative Fuels Data Center, Emissions from Hybrid and Plug-in Electric Vehicles. Accessed December 21, 2023.
8 "Steel's Contribution to a Low Carbon Future and Climate Resilient Societies." World Steel Association 2020.


Want to learn more?
Check out these related Explainers, written by scientists and experts from MIT and beyond.