Description
The past three years have been the three hottest humanity has ever measured. But who does the measuring, and how? Dr. Samantha Burgess, of the European Union’s Copernicus Climate Change Service, joins the show to explain how we know the temperature of the Earth, and how a global community of scientists works together to keep tabs on the health of our planet.
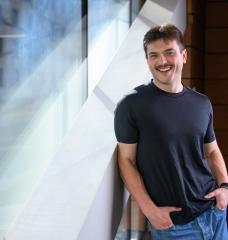
Dr. Samantha Burgess is Deputy Director of the Copernicus Climate Change Service (C3S), implemented by the European Centre for Medium-Range Weather Forecasts. Within C3S, Burgess leads the climate monitoring, climate observations and quality assurance parts of the program, working to improve public understanding of climate risks and inform decision-making for society and governments. She has previously worked in ocean science and policy in environmental nonprofits and for the U.K. government as Chief Scientific Advisor to the Marine Management Organisation. She holds a doctorate in marine geochemistry from Australian National University and conducted postdoctoral research in paleoclimatology at the University of Oxford.
For more episodes of Ask MIT Climate, visit climate.mit.edu, where you can also find our online Q&A series and sign up for our newsletter. Subscribe wherever you get your podcasts, and find us on Instagram, TikTok, and YouTube for outtakes, bonus content, and more climate knowledge from MIT. As always, we love hearing from our listeners; email us at askmitclimate@mit.edu.
Credits:
Aaron Krol, Writer and Executive Producer
Madison Goldberg, Host and Associate Producer
David Lishansky, Editor and Producer
Michelle Harris, Fact-checker
Music by Blue Dot Sessions
Transcript
Madison Goldberg: I have a question for you: How warm is the Earth? Is it, like, swimming pool-temperature? Hotter, colder? How do you even answer this question for a planet that’s home to both Mount Everest and Death Valley?
I’m Madison Goldberg, and you’re listening to Ask MIT Climate. And today, we’re spending some time on one of the most fundamental questions in climate science. Because, even though it sounds pretty straightforward, it’s not so easy to answer. And as we learn how scientists take the world’s temperature, we’ll also hear what it’s like to be part of a global community keeping an eye on the planet.
Our guest today works at the heart of that community.
Samantha Burgess: So my name is Dr. Samantha Burgess, and I'm the strategic lead for climate at the European Centre for Medium-range Weather Forecasts, ECMWF, and deputy director of the Copernicus Climate Change Service.
MG: Copernicus is the part of Europe's space program that tracks what’s going on here on Earth, like flood and fire risks and changes in land cover. In her role, Dr. Burgess pays special attention to the pace of climate change—including, yes, the planet’s temperature.
SB: The Earth's average temperature is fifteen point something degrees Celsius. And apologies, I will only work in degrees Celsius. So hopefully you guys can translate.
MG: We can do that. These days, the Earth is running, on average, around 59° Fahrenheit.
But—hold on. What does that actually mean? It’s winter in Massachusetts as we record this, and I could really use a 60-degree day.
SB: As you may imagine, for us to say that the global average temperature is fifteen degrees, that isn't meaningful to a lot of people when in summer they might experience up to forty degrees Celsius, and in winter they might experience below zero degrees.
MG: But the fact is, the Earth’s average temperature does affect our lives. It sets the boundaries that weather works in: How much rain can fall in a heavy storm? What are the chances of a winter evening bringing snow, or a summer day blazing above 100 degrees Fahrenheit?
To see the big picture of the planet’s temperature, we need a ton of measurements. There are literally tens of thousands of thermometers all around the world collecting temperature data, from weather stations, ships, and ocean buoys, and sending that data to programs like Copernicus. Add all those readings together over the many decades we’ve been collecting them, and…
SB: We have about a billion thermometer measurements since the pre-industrial period.
That’s also combined with satellite data. Satellites can’t measure temperature directly, because they’re up in space, so they measure the background microwave radiation from oxygen in our atmosphere.
MG: We won’t get into the details of that, but just know that these satellites add their own data to the pile, around the clock.
All these readings are vital to weather forecasting. They tell us where warm and cold fronts are traveling, how much strength a hurricane might pick up, and more.
They’re also crucial to climate science. But it’s not enough just to know what the Earth’s temperature is, or how it’s changing. We also want to know why.
SB: We've known for over a hundred and fifty years through experiments that carbon dioxide and other types of aerosols have influence on the temperature in our atmosphere. And we see this very strong correlation between carbon dioxide concentrations in the atmosphere and global average temperature.
MG: Carbon dioxide is good at trapping heat. This was first shown in the lab way back in the 1850s. And as humanity has burned huge amounts of fossil fuels and filled our atmosphere with more and more CO2, we’ve seen the Earth’s temperature rise as well.
SB: And so these one billion thermometer measurements I talked about show that our global average temperature has increased about one point three to one point four degrees above the pre-industrial period.
MG: But for something this important, we need to be really, really sure. What if it’s not our CO2 pollution that’s heating the planet? Lots of natural events can nudge the Earth’s temperature up or down, too.
SB: The one that has the biggest footprint on global temperature is the El Niño Southern Oscillation. So it has a warmer phase called El Niño, where it has a warming impact on global average temperatures. And then it has the La Niña phase, where it has a cooling effect on global average temperature. There's also the North Atlantic Oscillation. The Indian Ocean dipole. The Pacific decadal oscillation. In addition to those, there's the solar cycle. So there's an eleven-year solar cycle. Volcanoes have a cooling impact. So that's why we combine a lot of different measurements together and, and why we look at these long-term averages.
MG: By collecting enough data over enough time, we can see that none of these natural events comes close to explaining the warming we’re dealing with today.
SB: El Niño, for example, when it's in the warm phase, it adds zero point one to zero point two degrees of warming to the signal.
MG: Scientists also need to be careful that the way they measure temperature isn’t muddying the picture. For example, many older weather stations are warming up for reasons that have nothing to do with climate change.
SB: One of the challenges is that this particular weather station is showing warming because it used to be in the middle of a field in the countryside, and now it's in a city, in a built environment. It has lots of those hard surfaces that are warming things up a bit more than average.
MG: So scientists have to look out for these quirks in the data.
SB: So for an example, if you had two weather stations that were five kilometers apart and one was showing a rate of warming that was twice the rate of the other, that wouldn't make sense from a scientific perspective. And you would look to the reason why that environment was showing that change or why the interpretation of the data was incorrect.
MG: Then you can filter out that data, or work out how big the urban heating effect is and adjust for it.
Underpinning all this work are observations. And even though we now have satellites watching from space, Dr. Burgess says we still need all those on-the-ground thermometers, located everywhere from the Sahara to Antarctica—gathering what scientists call “in-situ” data. Without it, both climate science and daily weather forecasts would suffer.
SB: And for me, this is the critical thing as well, that we can never, ever replace in-situ measurements with only satellite data, because we need that verification.
MG: But the thermometers that gather this in-situ data aren’t spread evenly throughout the world. For instance, we have far more measurements on land than in the ocean. And wealthier countries tend to have denser networks of weather stations.
SB: The World Meteorological Organization, the WMO, has a large program to improve investment in observations, particularly in the Global South.
One of the challenges that we face is there’s actually a decline in in-situ observations around the world. The individual meteorological stations have dropped off through time. They're expensive to maintain, so if you don't have that investment to support the staff and make sure the equipment is well maintained, then they often get lost, effectively.
MG: Okay, so we’ve talked a lot about how scientists measure global temperature today. But that’s only part of the story. Because to fully understand the change we’ve caused in Earth’s climate, we also have to look back into the past.
SB: So effectively, policymakers needed to have a time period to measure what the temperature was before humanity had really impacted that temperature. So we use the fifty-year period between 1850 and 1900 to create a sort of baseline of a temperature in Earth's history before the influence of large amounts of human-caused pollution entering our atmosphere.
MG: And if you thought it sounded tough to take Earth’s temperature today, imagine trying to gauge what it was before there was this giant network of weather stations and satellites. But there are ways of reconstructing the past.
SB: So humanity has always been interested in change of seasons, change between years. So we’ve had temperature measurements for hundreds upon hundreds of years, often associated with monasteries or universities, where they've had people measuring things for a very long time.
MG: By the late 1800s, there were enough regular observations from different parts of the world that researchers today can fill in a picture for the whole globe.
SB: The other fascinating thing about this field is that we're also looking at all of this traditional knowledge from other communities and how they're observing change, where sea ice is changing, flowering is changing, when birds breed is changing, when fish move into a particular location is changing. And these have also been observed for hundreds of years. One of the big parts of our program is data rescue. So we have a huge investment in rescuing and digitizing these early records that are found in books and archives and dusty warehouses around the place, to understand how we can increase the number of observations to constrain and improve our models back in time.
MG: Data rescue, by the way, is close to Dr. Burgess’s heart. Her husband is a scientist, too, who has worked with volunteers to save historical weather data from ship logbooks and handwritten rainfall records.
SB: One lady wrote to him, it was her responsibility when she was at school to measure the temperature. And she didn't do it very well. So she felt like this was giving back by doing it, you know, fifty years on and, you know, there's all these lovely stories of people who wanted to get into science and then got demotivated somehow, but they've always had this fascination.
MG: Working together is what makes it possible to measure something as big as the Earth—whether you’re volunteering your spare time to rescue weather records, or dedicating your career to modeling the climate. In fact, the Copernicus Program is just one of eight separate efforts to measure the temperature of the planet.
SB: So there's three in the US, so it's NASA, NOAA, and Berkeley Earth. There's the UK Met Office and the Hadley Centre. And then there is ECMWF and the Japanese Meteorological Agency.
MG: There’s also China’s program, CMST, and a joint U.S./U.K. effort called DCENT. And it’s good to have all eight, because we can see how well they match up. Over the past 75 years or so, they're in very close agreement, even though none of their models work quite the same way. That’s one reason we can be so sure the warming they’re picking up is real.
For the 1800s, scientists are working with less and shakier data. The different models are still close, and see the same ups and downs from year to year, but they don’t fully agree. We’re talking a difference of like 0.1 to 0.3 degrees Celsius.
And this is just part of this process. You measure as best as you can, and you show your work, and you try to make clear what you don’t yet know. And—what you do know.
SB: And I think this is one of the challenges that we face with leveraging model data and with using scientific terminology that, you know, when we talk about theories and uncertainty and anomalies, people tune out and sort of go, well, you're not really sure. But the human impact on climate change is unequivocable.
Sometimes the data, it can be scary in terms of the sheer number of records that have been exceeded over the last two years in particular. We know it's not just about global average temperature. We know in a warmer planet, we get more extreme events, extreme heat waves, flooding events, wildfires, droughts, all of those things are increasing. So I have the privilege of communicating that data as effectively as I can to enable people to understand what it means for them and what it means for their choices. We need to ensure that the generations that come after us are inheriting not only the best science, but also that we're leaving the planet as well informed and as well adapted as we can.
MG: Ask MIT Climate is the climate change podcast of the Massachusetts Institute of Technology. Aaron Krol is our executive producer, and the writer for today’s episode. David Lishansky is our sound editor and producer. Michelle Harris fact-checks our episodes. The music is by Blue Dot Sessions. And I’m your host and associate producer, Madison Goldberg.
Many thanks to Dr. Samantha Burgess for speaking with us. You can find more Ask MIT Climate, and all our other climate learning resources, at climate.mit.edu. We’re also on TikTok, Instagram, and Youtube @askmitclimate. And if there’s other climate data you’re still processing, we want to hear your questions! Write to us at askmitclimate@mit.edu.
Dive Deeper
- Read more about Dr. Burgess and the Copernicus Climate Change Service.
- Chapter 2 of the MIT Climate Primer explains how scientists measure both historic and prehistoric global temperatures.
- Check out these related resources from the MIT Climate Portal:
- The Copernicus Climate Change Service’s ERA explorer app lets users view interactive temperature and climate data around the world.
- The National Oceanic and Atmospheric Administration releases an annual report on the state of the global climate.
- NASA breaks down how global temperature data is collected and adjusted to account for measurement biases.
- Woods Hole Oceanographic Institution explains El Niño and other oscillations in Earth’s oceans and atmosphere that can temporarily influence global temperatures.
- Interested in how non-scientists can get involved in improving our knowledge of the Earth? GloSAT explains how volunteers rescued global weather records, and more examples of “citizen science” projects (for climate science and beyond) can be found at NOAA, NASA, and the National Environmental Education Foundation.
- For an overview of climate change, check out our climate primer: Climate Science and Climate Risk (by Prof. Kerry Emanuel).
- For more episodes of Ask MIT Climate, visit askmitclimate.org.
We fact-check our episodes. Click here to download our list of sources.