New to Climate Change?
Public Transportation
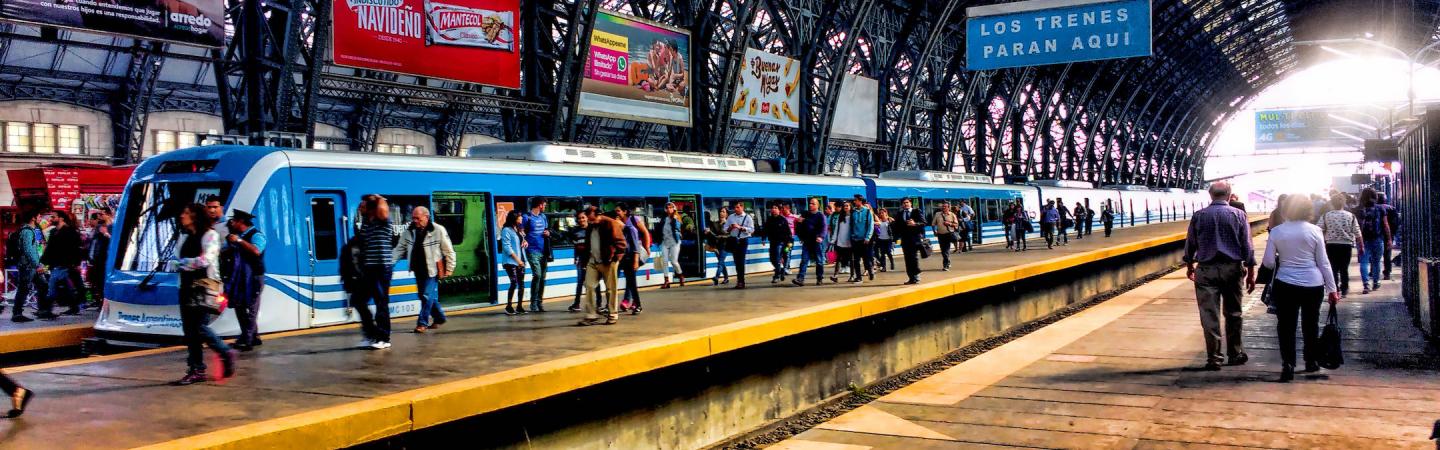
Public transportation gets people where they’re going while emitting far fewer climate-warming greenhouse gases than private cars. The reason is simple efficiency: while cars usually carry just one or two people at a time, a bus can carry 50 or more, and a train in a large city may carry thousands.1
Since transportation creates more than a fifth of the world’s greenhouse gas emissions,2 shifting people from cars to public transit can do a lot to lower our impact on the climate. But people will only choose public transportation when it is their most convenient option for getting around.
Thinking about how we use street space
Public transportation works best where lots of people live and work. A train or subway line is a big investment, and only makes economic sense if it attracts plenty of riders. Buses need less infrastructure and can pencil out in smaller towns and less-dense neighborhoods, but still need a steady flow of users to run cost-effectively.
Unsurprisingly, this means public transportation is most popular in and around cities. But it also means choices about land use have a big effect on public transit. To grow ridership, cities and towns need to allow, and encourage, abundant housing and businesses near train and bus stops, a practice called “transit-oriented development.”
With the right design choices, good public transit is self-reinforcing. A train line that runs quickly and frequently between an area’s main business and population centers will attract plenty of riders, and give people and firms even more reason to locate close to stations. This creates a virtuous feedback loop, where well-trafficked stations bring in more ridership, more businesses, and higher property values,3 which lead to more tax revenues, which can be used to run trains even more frequently or add new lines reaching more neighborhoods. A variety of transit options can all support each other by creating a “synergy,” with the busiest routes served by trains, further routes served by buses or bike shares, and commuter rail or high-speed rail between cities extending the system even further.
Trade-offs
Public transportation and private cars can co-exist, but limited space does put them in competition. Bus-only lanes, which help buses make fast, frequent trips, also slow down other traffic. Highways and parking lots in city centers take space away from transit-oriented development.
Policy choices can also change the balance between cars and public transportation. A growing number of cities charge cars a fee to enter high-traffic areas (called “congestion pricing”). This discourages car use, leading to less traffic and better air quality.
Ultimately, people choose how to get around based on their own benefit-cost calculations. Private cars have real benefits: drivers can travel on their own schedules and choose their own routes. But public transportation also has large benefits. It’s less expensive than owning a car, safer, and riders can work or relax while traveling.
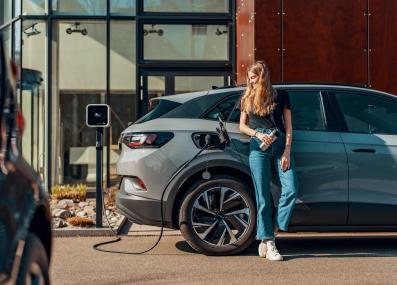
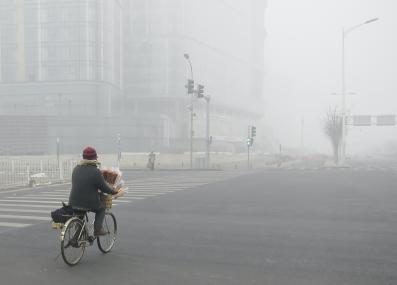
And when policymakers tip the scales toward public transit, they can unlock broader, shared benefits. These include lower greenhouse gas emissions, and good opportunities to take further climate action. For instance, cities can upgrade their train systems and bus fleets to run on clean electricity instead of fossil fuels—an easier task than nudging many car owners to do the same. But the benefits also include less urban sprawl, better air quality,4 and fewer traffic accidents. And a strong public transit system is better for an area’s poorest residents, who can least afford a private car.
Public transportation around the world
In wealthy countries with a history of transit-oriented development—like Japan, South Korea, Switzerland and Germany—public transit use is high, and greenhouse gas emissions from transportation are relatively low. In the U.S., which has invested more in highways, public transit use has fallen dramatically since the 1960s,5 and transportation emits more greenhouse gases than any other sector of the economy.6
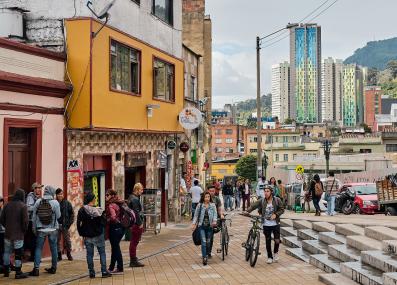
But in much of the developing world, public transit use is high mainly because most residents can’t afford cars. Fast-growing countries from Kenya to Colombia to the Philippines have a chance to build on a culture of public transit to keep emissions from transportation low even as their people grow wealthier. In China, the swift economic growth of the past 40 years has been paired with investments in the world’s largest rail and high-speed rail networks, keeping large numbers of riders in the public transit system even as more and more of them can afford their own cars.7
Published February 21, 2023.
1 The effect of different modes of travel on the climate can be measured in “grams of carbon dioxide-equivalent per passenger-kilometer” (gCO2-eq/pkm), or how much CO2 and other greenhouse gases a single passenger puts in the atmosphere for every kilometer they travel. According to the International Energy Agency, cars emit between 57 and 322 gCO2-eq/pkm—compared to buses at just 22-92 gCO2-eq/pkm, and trains at 6-118 gCO2-eq/pkm. International Energy Agency: “GHG intensity of passenger transit modes, 2019.”
2 International Energy Agency: “Net Zero by 2050: A Roadmap for the Global Energy Sector,” May 2021.
3 See for instance Borges Costa, Adriano, Camila Ramos, and Siqi Zheng, “Subway expansion, job accessibility improvements, and home value appreciation in four global cities: Considering both local and network effects,” Journal of Transport and Land Use, Vol. 15, No. 1 (2022), doi:10.5198/jtlu.2022.2146.
4 See for instance Zheng, Siqi, et al., “The effect of a new subway line on local air quality: A case study in Changsha,” Transportation Research Part D: Transport and Environment, Vol. 68 (2019), doi:10.1016/j.trd.2017.10.004.
5 U.S. Census Bureau: “Commuting by Public Transportation in the United States: 2019,” April 2021. Figure 7, “Percent of Workers Commuting by Public Transportation in the United States: 1960-2019,” page 9.
6 EPA: Sources of Greenhouse Gas Emissions. Accessed February 21, 2023.
7 See for instance Zhang, Yingjie, et al., “Does subway proximity discourage automobility? Evidence from Beijing,” Transportation Research Part D: Transport and Environment, Vol. 52, Part B (2017), doi:10.1016/j.trd.2016.11.009.


More Resources for Learning
Want to learn more?
Listen to this episode of MIT's "Today I Learned: Climate" podcast on everyday travel.
Keep exploring
With more Explainers from our library: