New to climate change?
Climate Scenarios
In climate change research, scenarios are tools used to explore different possible futures. They consider how trends in world population, economic growth, energy sources, land use, and other factors could affect humanity's climate-warming greenhouse gas emissions. To create a “climate scenario,” these emissions are then run through a climate model, revealing how they might change the Earth's climate, with physical effects like global warming, sea level rise, and shifts in extreme weather.
Some scenarios are widely shared and analyzed—especially the “RCP” and “SSP” scenarios highlighted by the Intergovernmental Panel on Climate Change (more on those below)—but researchers create many different scenarios for different purposes.
What scenarios do (and don’t) tell us
Climate scenarios are not predictions. They are “what-ifs” to help us think more clearly about how our choices affect the planet. Ideally, researchers and policymakers would consider a range of scenarios, asking how different policy choices and social and technological changes might play out, and the climate risks that might result.
The simplest scenarios do no more than posit different levels of greenhouse gases humans might add to the atmosphere. These are useful for asking questions like, “What risks would we face if emissions stay the same for the next 100 years?” or “What limits on emissions would likely keep global warming under 2° C?”
More comprehensive scenarios develop rich stories that link socioeconomic changes to emissions to climate outcomes. These scenarios ask questions about how different economic sectors will evolve, how countries will relate to each other, or how quickly new technologies might deploy at scale. Using socioeconomic and climate models, they also translate these trends into patterns of energy and land use, economic change, and resulting emissions and climate outcomes.
Climate scenarios are most useful for thinking about the long-term future, since it takes time for decisions made today to greatly affect greenhouse gas levels and the Earth’s climate. However, that long view can inform decisions we make today about reducing and adapting to climate change, by illuminating outcomes we want to achieve or avoid and the actions needed to do so.
Uncertainty and risk
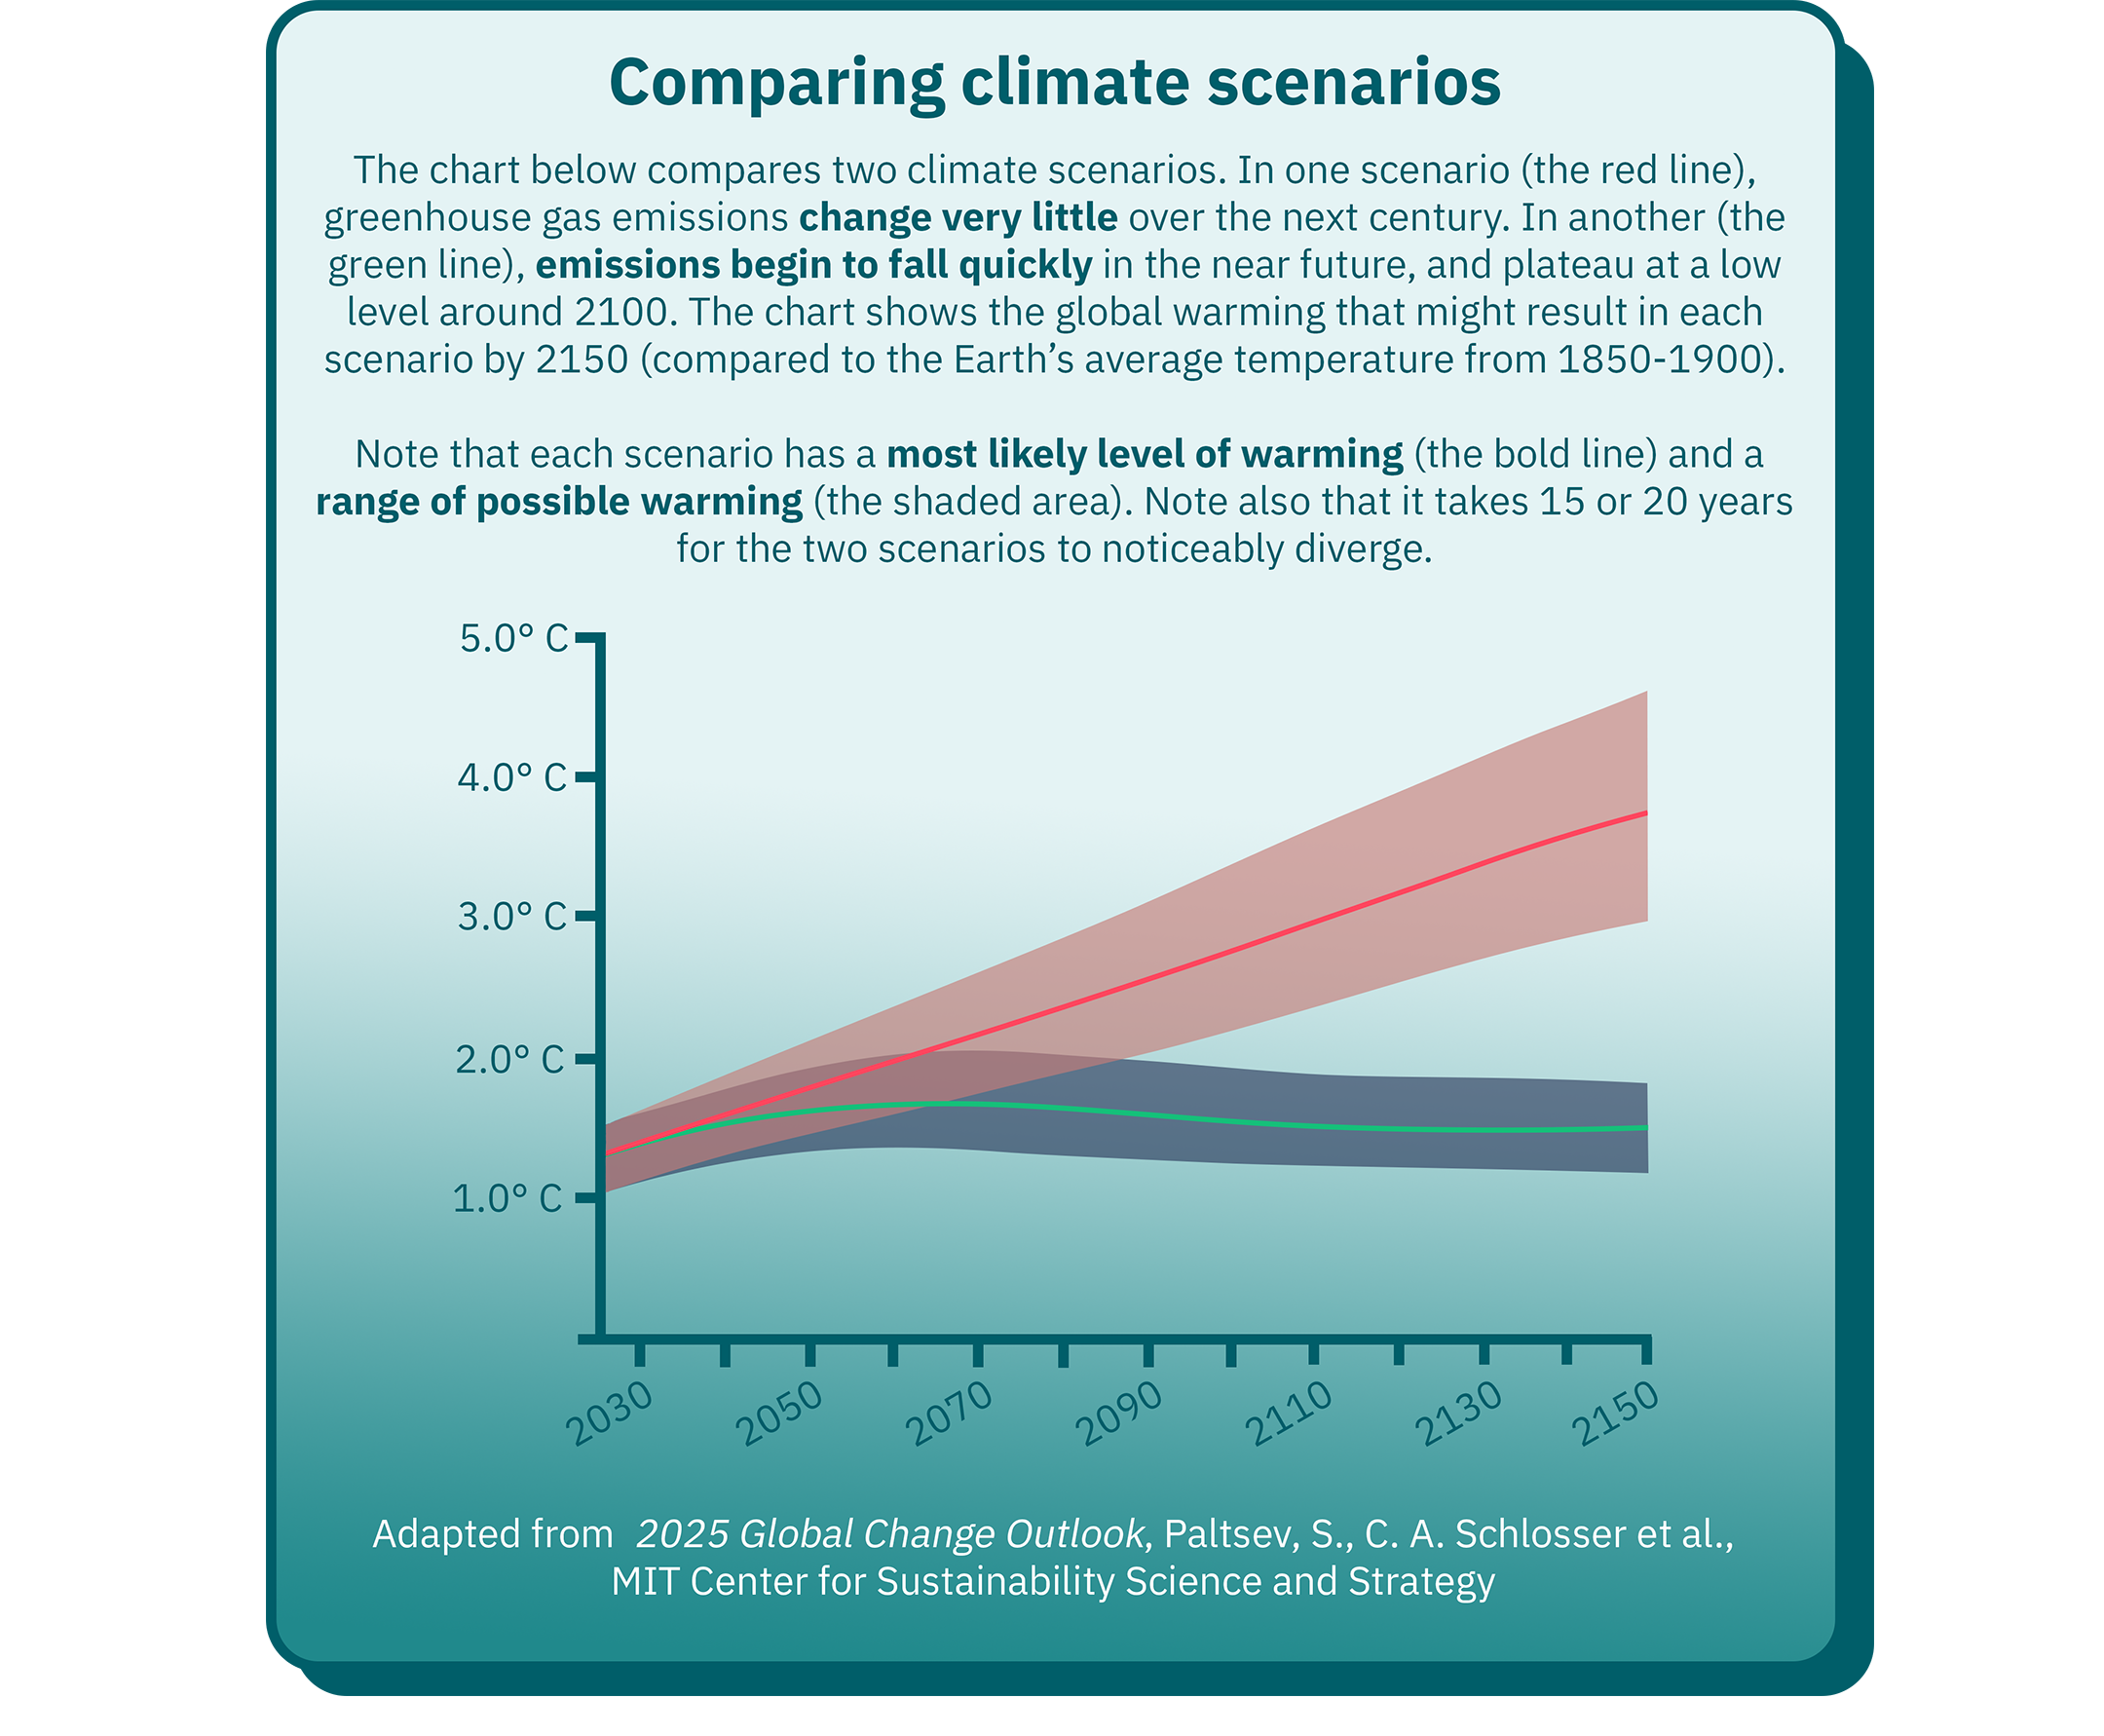
Uncertainty is baked into every climate scenario, as its designers must make assumptions about factors like population and economic growth and technology costs—things that don’t follow mathematical laws and could evolve in many ways. Climate models add their own uncertainties as they simplify Earth’s enormously complex climate into something a computer can simulate.
This means that, while scenarios can provide central estimates of future warming (a “most likely” outcome), they also show a much wider range of plausible warming. Climate scientists pay a lot of attention to the “tail risks” at the extreme end of these ranges, and encourage planning for them, the same way we buy insurance against unlikely disasters like house fires.
This uncertainty does not mean we know nothing. Comparing different climate scenarios shows that the range of possible futures depends greatly on actions we take now. And tail risks can show us the worst-case scenarios we need to plan for as we adapt to a changing planet—and what choices would tilt the odds in our favor.
The RCP and SSP scenarios
The best-known scenarios are developed by the scientific community in support of the Intergovernmental Panel on Climate Change (IPCC) and its work summarizing the state of climate science. A key player in this effort is the Coupled Model Intercomparison Project (CMIP), which arranges for the same scenarios to be run in standardized ways through multiple climate models, providing well-vetted information on a few shared scenarios that can be used in IPCC reports.
In 2010, CMIP began using the “representative concentration pathways” (RCPs).1 The RCPs are the simplest kind of scenarios: just future levels of greenhouse gases, without any storylines about the conditions that would drive those levels. Ranging from the mildest RCP2.6 to the most extreme RCP8.5,2 they were chosen to span a range of plausible climate outcomes by the year 2100.
In 2017, scientists supplemented the RCPs with “shared socioeconomic pathways” (SSPs).3 These scenarios tell larger stories about global politics, policy, and socioeconomic development. Under CMIP, SSPs are paired with the RCPs most consistent with the economic changes they describe.
Today, the latest CMIP effort is developing new, updated scenarios that build on the SSP storylines, translate their assumptions into emissions and climate risks, draw plausible pathways from the present state of the world, and extend to the year 2150 and beyond.4
The shared socioeconomic pathways (click to expand table)
| Name | Description5 | Paired with RCP(s) | Very likely range of global warming by 21006 |
|---|---|---|---|
| SSP1: Sustainability | The world responds more to climate change and other environmental challenges. Countries cooperate more and people consume less. More investment goes to clean energy, education, and healthcare. | 1.9 and 2.6 | 1.0-2.4° C |
| SSP2: Middle of the Road | The world largely follows recent historical trends. Modest but uneven improvements are made in global living conditions, clean technologies, and access to basic necessities. | 4.5 | 2.1-3.5° C |
| SSP3: Regional Rivalry | Rising nationalism, conflict, and authoritarianism lead countries to turn inward. There is less trade and economic development, and weaker global cooperation. | 7.0 | 2.8-4.6° C |
| SSP4: Inequality | Gaps in wealth and income grow both within and between countries. Conflict and unrest rise, and investments in development fall. Advanced technologies, including in clean energy, flourish in some pockets of the world. | 3.4 and 6.0 | N/A7 |
| SSP5: Fossil-fueled Development | Rapid, worldwide economic growth lifts living conditions and investments in healthcare and education, powered by rising exploitation of natural resources, including fossil fuels. Societies largely choose to adapt to climate change and environmental challenges rather than prevent them. | 8.5 | 3.3-5.7° C |
“Business-as-usual” and “worst-case” scenarios
RCP8.5 has met with particular attention and controversy. Although designed to be a high-end or “worst-case” scenario, some have incorrectly labeled it a “business-as-usual” scenario, noting it was only consistent with futures in which the world took no concerted action to stop climate change. In fact, when the RCPs were created, the warming in RCP8.5 was on the very high end of existing “baseline” scenarios—so even in the absence of major climate action, it was never the most likely case.8
As facts on the ground have changed—clean energy sources like wind and solar have grown cheaper, many countries have enacted new climate policies, and the rise in global emissions has slowed—RCP8.5, never the most likely scenario, now looks highly implausible. Even the most extreme scenario in CMIP’s next set will be somewhat more moderate.4 (There will also be no parallel to the most optimistic SSP1-1.9 scenario. Real events have narrowed the range of plausible climate futures.)
What can we learn from this?
One lesson is that “business-as-usual” is constantly evolving. For example, older “business-as-usual” scenarios reflected a world with very few climate- or energy-related policies and did not anticipate the rise of wind and solar. This is one good reason to look at a range of scenarios, and not fixate on just one.
We can also learn to make clearer use of high-risk, low-probability scenarios. Until humans zero out our greenhouse gas emissions, we can only delay, not avert, ever greater warming. And the uncertainty in climate models implies that even moderate emissions may lead to extreme climate outcomes (and vice versa). Both facts keep “worst-case” scenarios relevant to our planning. We can see this in CMIP’s new highest-emission scenario, which, while more moderate than RCP8.5, has large overlap in the climate risks it projects, though shifted further into the future.4
But perhaps the most important lesson is that our actions matter. In 2010, more serious and immediate climate risks were on the table than seem plausible today. Since then, policymakers, scientists, engineers, and citizens the world over have made choices that set the world on a different path—and the scenarios we explore for the future must change, too.
Published June 24, 2026
1 Moss, Richard, et al. "The next generation of scenarios for climate change research and assessment." Nature 463 (2010). https://doi.org/10.1038/nature08823.
2 The names correspond to the most likely level of warming associated with each scenario. RCP8.5, for example, corresponds with 8.5 watts per square meter of “radiative forcing,” a measure of the energy absorbed by the Earth’s surface from incoming sunlight, in the year 2100.
3 Riahi, Keywan, et al. "The Shared Socioeconomic Pathways and their energy, land use, and greenhouse gas emissions implications: An overview." Global Environmental Change 42 (2017). https://doi.org/10.1016/j.gloenvcha.2016.05.009.
4 van Vuuren, Detlef, et al. "The Scenario Model Intercomparison Project for CMIP7 (ScenarioMIP-CMIP7)." Geoscientific Model Development 19 (2026). https://doi.org/10.5194/gmd-19-2627-2026.
5 Descriptions of the SSPs are adapted from International Institute for Applied Systems Analysis: The SSP Framework (2018).
6 Lee, June-Yi, et al. "2021: Future Global Climate: Scenario-Based Projections and Near-Term Information." In Climate Change 2021: The Physical Science Basis. Contribution of Working Group I to the Sixth Assessment Report of the Intergovernmental Panel on Climate Change. Cambridge University Press (2023). https://doi.org/10.1017/9781009157896.006. See Table 4.5 for details.
7 The IPCC designated SSP4-3.4 and SSP4-6.0 as “Tier 2” scenarios and did not request that contributing scientists run these scenarios as many times through as many models as their counterparts shown in this table. Directly comparable figures therefore do not exist for these scenarios.
8 van Vuuren, Detlef, et al. "The representative concentration pathways: An overview." Climatic Change 109 (2011). https://doi.org/10.1007/s10584-011-0148-z.


More Resources for Learning
Want to learn more?
Listen to this episode of the Ask MIT Climate podcast on uncertainty and risk in preparing for climate change.
Keep exploring
With more Explainers from our library: