Climate
    • What We Know
    • What Can Be Done
    • Climate Primer
    • Podcast
    • Explainers
    • Climate Questions
    • For Educators
    • News
    • Events
    • Resources
  • Search
Search
MIT

Main navigation

    • What We Know
    • What Can Be Done
    • Climate Primer
    • Podcast
    • Explainers
    • Climate Questions
    • For Educators
    • News
    • Events
    • Resources
  • Search
PostAugust 6, 2021

New global map shows populations are growing faster in flood-prone areas

Dhaka, Bangladesh has experienced some of the largest increases in flood exposure, according to a new global flood mapping project.

Even as climate change and urbanization make floods more frequent and their consequences more severe, a higher proportion of people are living in areas that experience them.

In a new study published today in Nature, researchers used satellite images to map over 900 flood events that occurred between 2000 and 2018, affecting between 255 million and 290 million people.

And while the global population grew by 18.6% from 2000 to 2015, the population in these areas outpaced that growth, increasing by 34.1% over the same period. That means between 58 million and 86 million more people were exposed to flooding in those places over the course of 15 years.

Read the full article at: https://www.technologyreview.com/2021/08/04/1030533/population-climate-flood-risk/

Image by: Mamunur Rashid/Alamy Live News

by MIT Technology Review
Topics
Cities & Planning
Climate Modeling
Food, Water & Agriculture
Government & Policy
National Security
Flooding

Related Posts

PostNovember 17, 2026

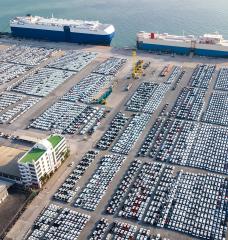
Tariffs, Global Value Chains, and the Incidence of Protection: Evidence fro...

MIT Center for Energy and Environmental Policy Research
PostNovember 2, 2026

PODCAST: Climate Reveal (Season 3, Episode 1) - Tipping Points

MIT Center for Sustainability Science and Strategy
Climate Reveal Podcast
PostOctober 30, 2026

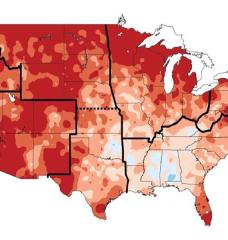
Study pinpoints states with steepest warming trends since 1980

MIT News
A new study reports global-warming-attributed trends in monthly-averaged maximum daily temperature for every U.S. state. Shown here are temperature changes (highest increases in deeper red and dark orange) between 1991 and 2012 compared to the average temperature between 1901 and 1960.
PostOctober 28, 2026

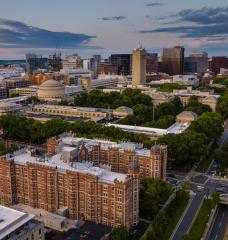
3 Questions: Why infrastructure is entering a defining era

MIT Civil and Environmental Engineering
“Designing infrastructure is a highly transdisciplinary, sociotechnical endeavor, involving social, technical, and economic considerations. Understanding how these systems are designed is increasingly important because they are becoming more complex, making decision-making particularly difficult,” says Ali Jadbabaie, JR East Professor and head of the Department of Civil and Environmental Engineering.

MIT Climate Knowledge in Your Inbox


MIT Groups Log In

Log In

Footer

  • About
  • Terms & Conditions
  • Privacy Policy
  • Accessibility
  • Contact
MIT Climate Project
MIT
  • Instagram
  • TikTok
  • YouTube
  • Simplecast
Communicator Award Winner