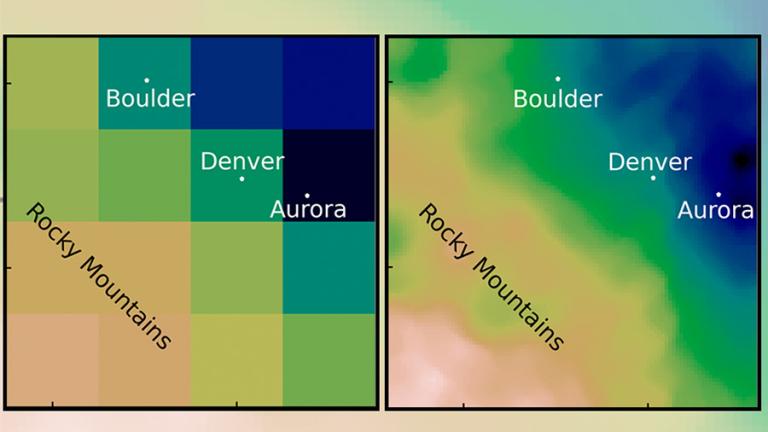
Climate models are a key technology in predicting the impacts of climate change. By running simulations of the Earth’s climate, scientists and policymakers can estimate conditions like sea level rise, flooding, and rising temperatures, and make decisions about how to appropriately respond. But current climate models struggle to provide this information quickly or affordably enough to be useful on smaller scales, such as the size of a city.
Now, authors of a new open-access paper published in the Journal of Advances in Modeling Earth Systems have found a method to leverage machine learning to utilize the benefits of current climate models, while reducing the computational costs needed to run them.
“It turns the traditional wisdom on its head,” says Sai Ravela, a principal research scientist in MIT’s Department of Earth, Atmospheric and Planetary Sciences (EAPS) who wrote the paper with EAPS postdoc Anamitra Saha.
Traditional wisdom
In climate modeling, downscaling is the process of using a global climate model with coarse resolution to generate finer details over smaller regions. Imagine a digital picture: A global model is a large picture of the world with a low number of pixels. To downscale, you zoom in on just the section of the photo you want to look at — for example, Boston. But because the original picture was low resolution, the new version is blurry; it doesn’t give enough detail to be particularly useful.
“If you go from coarse resolution to fine resolution, you have to add information somehow,” explains Saha. Downscaling attempts to add that information back in by filling in the missing pixels. “That addition of information can happen two ways: Either it can come from theory, or it can come from data.”
Conventional downscaling often involves using models built on physics (such as the process of air rising, cooling, and condensing, or the landscape of the area), and supplementing it with statistical data taken from historical observations. But this method is computationally taxing: It takes a lot of time and computing power to run, while also being expensive.
A little bit of both
In their new paper, Saha and Ravela have figured out a way to add the data another way. They’ve employed a technique in machine learning called adversarial learning. It uses two machines: One generates data to go into our photo. But the other machine judges the sample by comparing it to actual data. If it thinks the image is fake, then the first machine has to try again until it convinces the second machine. The end-goal of the process is to create super-resolution data.
Using machine learning techniques like adversarial learning is not a new idea in climate modeling; where it currently struggles is its inability to handle large amounts of basic physics, like conservation laws. The researchers discovered that simplifying the physics going in and supplementing it with statistics from the historical data was enough to generate the results they needed.
“If you augment machine learning with some information from the statistics and simplified physics both, then suddenly, it’s magical,” says Ravela. He and Saha started with estimating extreme rainfall amounts by removing more complex physics equations and focusing on water vapor and land topography. They then generated general rainfall patterns for mountainous Denver and flat Chicago alike, applying historical accounts to correct the output. “It’s giving us extremes, like the physics does, at a much lower cost. And it’s giving us similar speeds to statistics, but at much higher resolution.”
Another unexpected benefit of the results was how little training data was needed. “The fact that that only a little bit of physics and little bit of statistics was enough to improve the performance of the ML [machine learning] model … was actually not obvious from the beginning,” says Saha. It only takes a few hours to train, and can produce results in minutes, an improvement over the months other models take to run.
Quantifying risk quickly
Being able to run the models quickly and often is a key requirement for stakeholders such as insurance companies and local policymakers. Ravela gives the example of Bangladesh: By seeing how extreme weather events will impact the country, decisions about what crops should be grown or where populations should migrate to can be made considering a very broad range of conditions and uncertainties as soon as possible.
“We can’t wait months or years to be able to quantify this risk,” he says. “You need to look out way into the future and at a large number of uncertainties to be able to say what might be a good decision.”
While the current model only looks at extreme precipitation, training it to examine other critical events, such as tropical storms, winds, and temperature, is the next step of the project. With a more robust model, Ravela is hoping to apply it to other places like Boston and Puerto Rico as part of a Climate Grand Challenges project.
“We’re very excited both by the methodology that we put together, as well as the potential applications that it could lead to,” he says.