Have a question?

Why isn’t sea level rise the same everywhere?

Thanks to shifting currents, groundwater pumping, and even ancient ice sheets, a community can experience a rate of sea level change that’s very different from the global average.


June 20, 2025

As humans pump climate-warming pollution into the air, heating up the atmosphere and oceans and melting vast tracts of ice, global sea level is rising. Averaged over the whole planet, the oceans are already more than 20 centimeters (roughly eight inches) higher than they were in 1900. And the rise is speeding up: Sea level climbed nearly twice as fast from 2006 to 2018 as it did in the several decades prior.1

But this global average doesn’t tell us how rising seas will affect people’s lives. As a result of many processes—from shifts in ocean currents to sinking of the land—different areas face different rates of sea level change. Some places, like Galveston, Texas, have seen the water rise far faster than the global average—by over two feet since 1904.2 In other places, sea level has risen more slowly. There are even places, like parts of Alaska, where sea level is falling.3

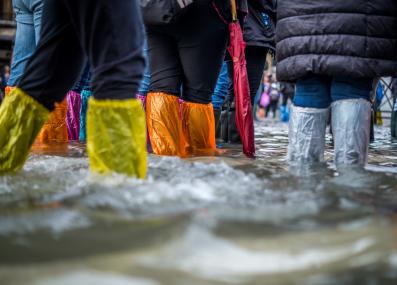
These local changes are what matter most for people, says Sarah Das, an associate scientist at the Woods Hole Oceanographic Institution. “What you experience is the impact of sea level rise on your community, your economy, your safety,” she says. Rising seas are already leaving their mark—magnifying hurricane damage4 and plaguing cities with more flooding at high tide5—with worse impacts on the way. To prepare for those impacts, you need to know “what sea level is doing in your backyard.”

Globally, sea level rise has two main culprits. For one, Das says, the ocean is doing a “heroic job” of absorbing the vast majority of the extra heat trapped by our climate pollution. As it warms, the water expands, driving up global sea level. On top of that, the warming atmosphere and oceans are melting ice sheets and glaciers, dumping enormous amounts of water into the sea.

But when ice melts into the ocean, the effect isn’t as straightforward as filling a bucket with a hose. For example, the ice sheets of Antarctica and Greenland exert their own gravitational pull on the ocean around them. “That knowledge really forces you to try to get your head around exactly how massive these ice sheets are,” Das says.

When an ice sheet loses mass, that pull weakens, and water moves away. That means (all else being equal) sea levels rise more in places farther from the melting ice sheet.6

This effect helps give each ice sheet a unique pattern, or “fingerprint,” of sea level change as it melts. As a result, melting ice in Antarctica has a bigger effect on the northeastern United States than melting a similar amount in Greenland.7

Shifts in the circulation of Earth’s atmosphere and in ocean currents can also fuel local changes in sea level. These shifts can redistribute seawater, causing sea level to rise in one area and dip in another. For example, strong trade winds in the Pacific Ocean normally push warm water westward, meaning seas sit higher off of places like Papua New Guinea in the western Pacific, and lower off of regions like the U.S. west coast. But natural weather patterns like El Niño, which appears irregularly every few years, can dampen those trade winds and let warm water move east. For places like California, sea level rise is sometimes magnified (like during El Niño years), and sometimes muted.8

There’s another wrinkle, too. “Land moves up and down. It moves on short timescales, long timescales. It moves smoothly; it moves erratically,” Das says. This motion means some places are dealing not only with rising seas, but also with falling land. In American Samoa, sinking land in the aftermath of a 2009 earthquake has driven sea level rise much faster than the global average.9 Human activity, like pumping out groundwater or oil and gas, can also cause the land to sag. Parts of coastal Louisiana and Texas saw a lot of this kind of fluid extraction in the mid-to-late 20th century, contributing to the region’s swift sea level rise.2, 10

In Earth’s land movement, we can also see the ghosts of ice sheets past. During the peak of the last ice age, around 20,000 years ago, sprawling ice sheets covered far more of the planet’s surface. This ice, over two miles thick in places, pressed down the land beneath it, while pushing up the Earth’s crust in the surrounding areas. (Imagine sitting on a mattress; beneath you, the mattress will sink, and around you, it will bulge upwards a bit.11) The Earth is still adjusting from the loss of so much ice, Das says. Gradually, the land that was underneath the vanished ice sheets is moving up, and the nearby bulges are collapsing.

In the Chesapeake Bay region, this process is causing land to sink and helping fuel faster-than-average sea level rise. Norfolk, Virginia, home to the world’s largest naval complex, has seen sea level climb a full foot since 1970.12 Meanwhile, Canada’s Hudson Bay has experienced sea level fall, as formerly ice-covered land rebounds.13

“None of these things are acting in isolation,” Das adds. They’re also not happening on the same timescales; relative sea level is affected by shorter-term shifts in ocean currents and the slow relaxation of the Earth’s crust. Which processes matter most depends on not only where you are, but whether you’re planning for the next two years or the next 200.14

The risks posed by rising seas are molded by all these overlapping processes—and many others. For example, while sea level rise has made high-tide flooding worse in the U.S.,15 researchers have found that the exact relationship differs from place to place. In some areas, like off the Gulf of Maine, because of the way the tides behave, seas don’t need to rise all that much to cause a big spike in flooding.5 Risks also depend on human factors, like how many people live near the coast, or whether critical infrastructure such as hospitals and airports are in the flood zone.

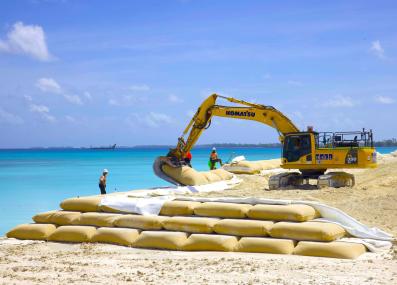
All these close-to-home variables matter as communities figure out how to adapt to higher seas—whether by building sea walls, restoring protective salt marshes, or helping people move away from the coast. And by curbing our climate pollution and slowing the rising seas, Das adds, we can buy ourselves more time to make these decisions. “If you had 20 more years to be resilient and adapt, that’s enormous.”


Submit your own question to Ask MIT Climate

Get the latest from Ask MIT Climate monthly in your inbox

Read more Ask MIT Climate

Creative Commons Attribution-NonCommercial-ShareAlike 4.0 International license (CC BY-NC-SA 4.0).
Footnotes

1 Gulev, Sergey K., et al. "Changing state of the climate system." (2021). In Masson-Delmotte, Valérie, et al (Eds.), Climate Change 2021: The Physical Science Basis. Contribution of Working Group I to the Sixth Assessment Report of the Intergovernmental Panel on Climate Change (pp. 287-422). https://doi.org/10.1017/9781009157896.004.

2 Liu, Yi, et al. "Land subsidence contributions to relative sea level rise at tide gauge Galveston Pier 21, Texas." Scientific Reports 10 (2020). https://doi.org/10.1038/s41598-020-74696-4.

3 Lindsey, Rebecca, et al. National Oceanic and Atmospheric Administration. "Interactive map: How has local sea level in the United States changed over time?" (December 20, 2021). Accessed June 2025.

4 Strauss, Benjamin H., et al. "Economic damages from Hurricane Sandy attributable to sea level rise caused by anthropogenic climate change." Nature Communications 12 (2021). https://doi.org/10.1038/s41467-021-22838-1.

5 Sun, Qiang, et al. "Causes of accelerated high-tide flooding in the U.S. since 1950." npj Climate and Atmospheric Science 6 (2023). https://doi.org/10.1038/s41612-023-00538-5.

6 Mitrovica, Jerry X., et al. "All sea level is local." Bulletin of the Atomic Scientists 74 (2018). https://doi.org/10.1080/00963402.2018.1461935.

7 Sweet, William V., et al. National Oceanic and Atmospheric Administration. Global and Regional Sea Level Rise Scenarios for the United States: Updated Mean Projections and Extreme Water Level Probabilities Along U.S. Coastlines. (2022).

8 Hamlington, Benjamin D., et al. "Past, present, and future Pacific sea-level change." Earth's Future 9 (2020). https://doi.org/10.1029/2020EF001839.

9 Han, Shin-Chan, et al. "Sea level rise in the Samoan Islands escalated by viscoelastic relaxation after the 2009 Samoa-Tonga Earthquake." JGR Solid Earth 124 (2019). https://doi.org/10.1029/2018JB017110; Huang, Stacey A., et al. "Spatiotemporal patterns of subsidence and sea level rise in the Samoan Islands 15 years after the 2009 Samoa-Tonga Earthquake." JGR Solid Earth 130 (2025). https://doi.org/10.1029/2024JB029765.

10 Kolker, Alexander S., et al. "An evaluation of subsidence rates and sea-level variability in the northern Gulf of Mexico." Geophysical Research Letters 38 (2011). https://doi.org/10.1029/2011GL049458.

11 National Oceanic and Atmospheric Administration. "What is glacial isostatic adjustment?" (Updated June 16, 2024). Accessed June 2025.

12 U.S. Global Change Research Program. U.S. Sea Level Change: National Sea Level Explorer. "Sewells Point." (Updated December 1, 2024). Accessed June 2025.

13 Hayden, Anna-Mireilla, et al. "Multi-century impacts of ice sheet retreat on sea level and ocean tides in Hudson Bay." JGR Oceans 125 (2020). https://doi.org/10.1029/2019JC015104.

14 Hamlington, Benjamin D., et al. "Understanding of contemporary regional sea-level change and the implications for the future." Reviews of Geophysics 58 (2020). https://doi.org/10.1029/2019RG000672.

15 Piecuch, Christopher G., et al. "Impact-based thresholds for investigation of high-tide flooding in the United States." Earth's Future 13 (2025). https://doi.org/10.1029/2024EF005850.

Want to learn more?

Listen to this episode of MIT's "Today I Learned: Climate" podcast on sea level rise.

Transcriptions

LHF: [00:00:00] Hello, and welcome to Today I Learned: Climate, the show where you learn about climate change from real scientists and experts. I’m Laur Hesse Fisher from the MIT Environmental Solutions Initiative. Today’s guest is joining from a long way away from us .

JR: [00:00:17] So I'm James Renwick. I'm a professor of physical geography at Victoria University of Wellington in New Zealand.

LHF: [00:00:26] Prof. Renwick is a lead author for the worldwide body of scientists who create the UN’s climate change reports: that’s the Intergovernmental Panel on Climate Change, or IPCC. Because these reports pull together all the world’s research on climate change, they are the best information the world has on how climate change is unfolding.

JR: [00:00:49] So I'm involved in a chapter on the water cycle and how that's changing. So that involves everything from—you know—rainfall or glaciers, groundwater, lakes, anything to do with water around the globe.

LHF: [00:01:03] We invited Prof. Renwick on the show because today, we’re talking about water. If you’ve only heard one thing about climate change, it might be that sea levels are rising, and many of the Earth’s islands and coastlines are at risk.

But -- why? We’re going to take two episodes to discuss sea level rise. Today, we’re going to dig into the science — what we know and how we know it — and then in the next episode, we’ll talk about what sea level rise looks like, what it means for us and what we can do about it.

OK so let’s get started. How do we know that the oceans are higher now than they used to be? And how do we know this is because of climate change?

New -- and old -- technology help scientists understand what’s happening.

JF: [00:01:50] Basically using GPS—differential GPS—you can look down from your satellite and tell very precisely how far away the sea surface is down to the millimeter scale. It's pretty cool science actually. I mean, it's the same GPS that's on everyone's phone and everything. It's done more precisely, but it's the same technology put to a really cool use. So we have these nice satellite records for the last 30 years, and we know they’re reliable and precise and so on. But of course, for a climate study, you want more than 30 years of information. That’s just not long enough to get a sense of any trends.

LHF: [00:02:32] Luckily, people have been interested in sea levels for much longer than 30 years—because merchants and fishing ships have always needed to know when the tides were high enough for their ships to move safely through ports. Port officials kept logs of how high the tide was from day to day.

JR: [00:02:50] We have reliable sea level measurements from tide gauges at ports around the world that go back to the late 19th century. So about 150 years of record, or so. Turns out there's enough of these things around the globe that you can form an estimate of how the average sea level is changing—if it's changing. And of course it wasn't changing for a long time until the greenhouse gas increase really started getting going.

LHF: [00:03:18] Yeah, what we see from the tide gauges and satellite data is that, globally on average, the oceans have been rising over the past 100 years -- and in this century, the 2000s, it’s been rising faster.

But why? It’s because the Earth is getting warmer. When we burn coal, oil and gas, we release a kind of pollution that hangs out in the atmosphere. And this pollution acts like a blanket, trapping in heat. When there’s too much of it, it warms up our air, our land, and, yeah, our oceans. In fact, most of this trapped heat goes into our oceans.

JR: [00:03:57] About 90% of the total heating from increased greenhouse gases in the atmosphere is going into ocean water. So, the ocean’s warming. And if you heat water it's going to expand.

This would work, you can try that out. If you put a cup of cold water in a microwave and heat it up, there'll be less room in the cup at the end of your little experiment.

LHF: [00:04:17] In our educator guide for this episode, we give you another easy demonstration of this that anyone can do at home -- to check out, go to tilclimate.mit.edu.

Of course, when ocean water expands, the only place it has to go is up. So that’s one cause of sea level rise.

JR: [00:04:37] But the other thing that's going on—has kind of taken over—and that's the melting of ice off of glaciers all around the world. Uh, and from the big ice sheets in Greenland and the Antarctic.

So it's making the ocean deeper all around the world. I mean, the oceans are pretty big. Um, so you need to melt a lot of ice to really noticeably raise sea levels. A number I keep in my head is, if you melt 360 billion tons of ice, and spread that water out of the global oceans, which happen to be about 360 million square kilometers in area. You get a layer that's one millimeter thick. And on the global average, we’ve had, I think, about 25 cm, which is, yeah, a little less than a foot of sea level rise since the late 19th century. So that's, when you work it out, that's, a lot of ice. It’s trillions of tons of ice that have already melted off, and the ice sheets of the world.

LHF: [00:05:41] So because of the water warming and expanding, and all this ice melting, there’s already been, as Prof. Renwick just said about 25 cm about 9” of sea level rise on average around the world. I say on average, because the sea actually rises faster in some places than others. There are a few reasons for that, a big one is how the Earth’s crust shifts and adjusts as ice melts, like from the last ice age 15,000 years ago. But that’s not all.

JR: [00:06:15] This ice on the ice sheets in Antarctica and Greenland, it’s such a big mass that basically they have their own gravitational field. They pull water towards them.

LHF: [00:06:28] Yeah, this ice is so big that it pulls ocean water towards it. And when these ice sheets get smaller, it changes the gravitational pull.

JR: [00:06:38] When ice melts off of Antarctica, a lot of that water ends up flowing into the Northern hemisphere. And in fact, pooling up along the U.S. coast.

So the eastern seaboard of the U.S.—of North America—is one of the parts of the world where sea level is going up faster than the global average.

LHF: [00:06:57] Around New York City and Miami, sea level has risen about a foot over the 1900s, and in certain coastal communities of North Carolina and Virginia, it’s already risen by about a foot and a half.

And the seas are still rising; in fact, they’re rising faster now than they were even a few decades ago. Because human activity is driving this sea level rise, we actually can slow it down.

JR: [00:07:27] If we turn off the emissions, the sooner we do that, the sooner the rate of sea level rise starts to decrease and plateau out. But we're not so sure about how long it would take to completely stop. The estimates are that maybe sea levels would keep rising for another century or two. It's most likely we would see something like a couple of feet of sea level rise but we could see double that much over time.

LHF: [00:07:54] And that’s if we stop our CO2 emissions -- if we don’t, there’s a possibility of getting way more than a couple of feet. To spell out this scenario, Prof. Renwick takes us back to Antarctica, and all the ice that it holds.

JR: [00:08:10] If you look down a map of the Southern hemisphere, looking down on the pole is a big continent, right over the pole, that’s Antarctica, sort of at the coldest place it could be. So the ice is about 4,000 meters thick, on the East Antarctic ice sheet.

LHF: [00:08:25] That’s about 2.5 miles of ice. And under all that ice is—land. Yeah, that’s why Antarctica is a continent, because there’s actually land there. All of this ice— heavy enough to push the land down.

JR: [00:08:45] In places, the Antarctic continent is, you know, hundreds of feet below sea level. And it’s ocean water that's lapping around the edge of these ice shelves. That's, that's, what's melting the Antarctic ice. So if this warming water around the coast can kind of get under the edge of the ice shelf and basically get over the coastline, it'll flow downhill with gravity. And float under the ice and start to float huge pieces of ice, melting from the bottom up. That would really accelerate the melting of the ice and the flow of that ice out into the ocean, which is, yeah, big news, bad news.

The estimates we have from modeling are that if global warming gets to be more than two degrees centigrade, let's say four Fahrenheit, then the ocean water around Antarctica will have gotten warm enough to cause that process to become unstoppable. And we'll lock-in four or five meters of sea level rise, at least. You know, what's that? 15 feet? That would be, yeah, catastrophic for pretty much every coastal city in the world that you can think of, I’d say. So there's a real, yeah, we're on a bit of a knife edge with sea level rise at the moment.

LHF: [00:10:07] What is the timeframe we’re talking about here?

JR: [00:10:10] So how long would it take to melt all of the ice on the West Antarctic? It takes a long time. We might lock in that melting within 30 years or so if we don't reduce emissions of greenhouse gases pretty quickly, but it would take several hundred years for all the ice to melt and maybe even a thousand years. So it's not something that's just going to happen over a weekend or something. Like we're not going to wake up and find, wow, sea level is now this much higher, I'm now floating, my house has disappeared.

Though, I think it’s really worrying if we know that we have consigned future generations to many, many meters of sea level rise. You know, we would be saying that all future generations would have a different, different map of the world. Humanity would have the time to adjust, but in the process, millions and millions of people would be displaced.

LHF: [00:11:08] This is a lot to think about. And it can also sound very far away—a century or two of rising seas. Which is why in our next episode, we’re going to bring Prof. Renwick back to help us understand how sea level rise is impacting people now, and what’s in store in the next couple of decades.

 In the meantime, we want to hear from you. You can find us on Twitter at @tilclimate, or send us an email at tilclimate@mit.edu. And tell your friends about us. You can subscribe to TILclimate on Apple, Spotify, or wherever you get your podcasts.

Thanks to Prof. Renwick for joining us, and thank you for listening.