
The design of transportation taxation has long been a critical issue in public finance, with policymakers seeking systems that are both efficient and equitable. In the United States, the federal gas tax—a longstanding mechanism for funding transportation infrastructure—has faced increasing scrutiny due to its declining revenues and concerns about fairness. This decline is largely driven by improvements in fuel efficiency and the accelerating adoption of electric vehicles (EVs), which do not contribute to gas tax revenues. As EV adoption grows, particularly in urban areas and coastal states, federal gas tax revenues are falling and are projected to continue falling. By law, revenues from this tax are earmarked for the Federal Highway Trust Fund, which finances a major portion of state and federal roadwork in the United States. This has led policymakers and analysts to explore options for replacing the gas tax. One option gaining traction is a vehicle miles traveled (VMT) tax, which charges drivers based on the distance they travel rather than the fuel they consume. Our research examines the winners and losers from transitioning the federal gas tax to a revenue-equivalent VMT tax, focusing on the distributional impacts across geography and political affiliation. The analysis is done at the census tract level.
For the highly disaggregated geographic analysis we undertake, we need to generate a prediction of household travel at the census tract level. There are about 80,000 census tracts in the United States with an average of 4,000 households per tract. Unfortunately, a measure of vehicle miles traveled at the census tract level does not exist. Instead, we predict household level annual vehicle miles at the census tract level using data from the 2017 National Household Transportation Survey (NHTS 2017), a nationally representative household travel survey, that provides household-level data on annual vehicle miles traveled and other household demographic characteristics, such as income, age, race, education, and employment for about 7,000 households. The survey also includes information on the number of vehicles owned by the household, the type of vehicles, and the use of public transport to travel to work.
The 2017 NHTS only provides geographic information at the nine Census division levels. Using household-level variables common to the NHTS and to the American Community Survey (ACS 2022), we construct a best-fit model from the 2017 NHTS and use that model to predict average household vehicle miles traveled at the tract level in the 2022 ACS.
Given the large number of possible variables available to us to predict household-level vehicle miles traveled, we use machine learning techniques to identify a best-fit model to apply to the ACS data.
Our first result is that the shift is modestly progressive in terms of income. The bars in Figure 1 report the average change from the tax swap and show that lower income groups (measured in deciles) on average gain from the tax swap while upper income groups in general pay more taxes. The whiskers report the range from the 25th to the 75th percentiles and demonstrate considerable heterogeneity within deciles while preserving the trend in negative burdens for lower-income households and positive burdens for higher-income households.
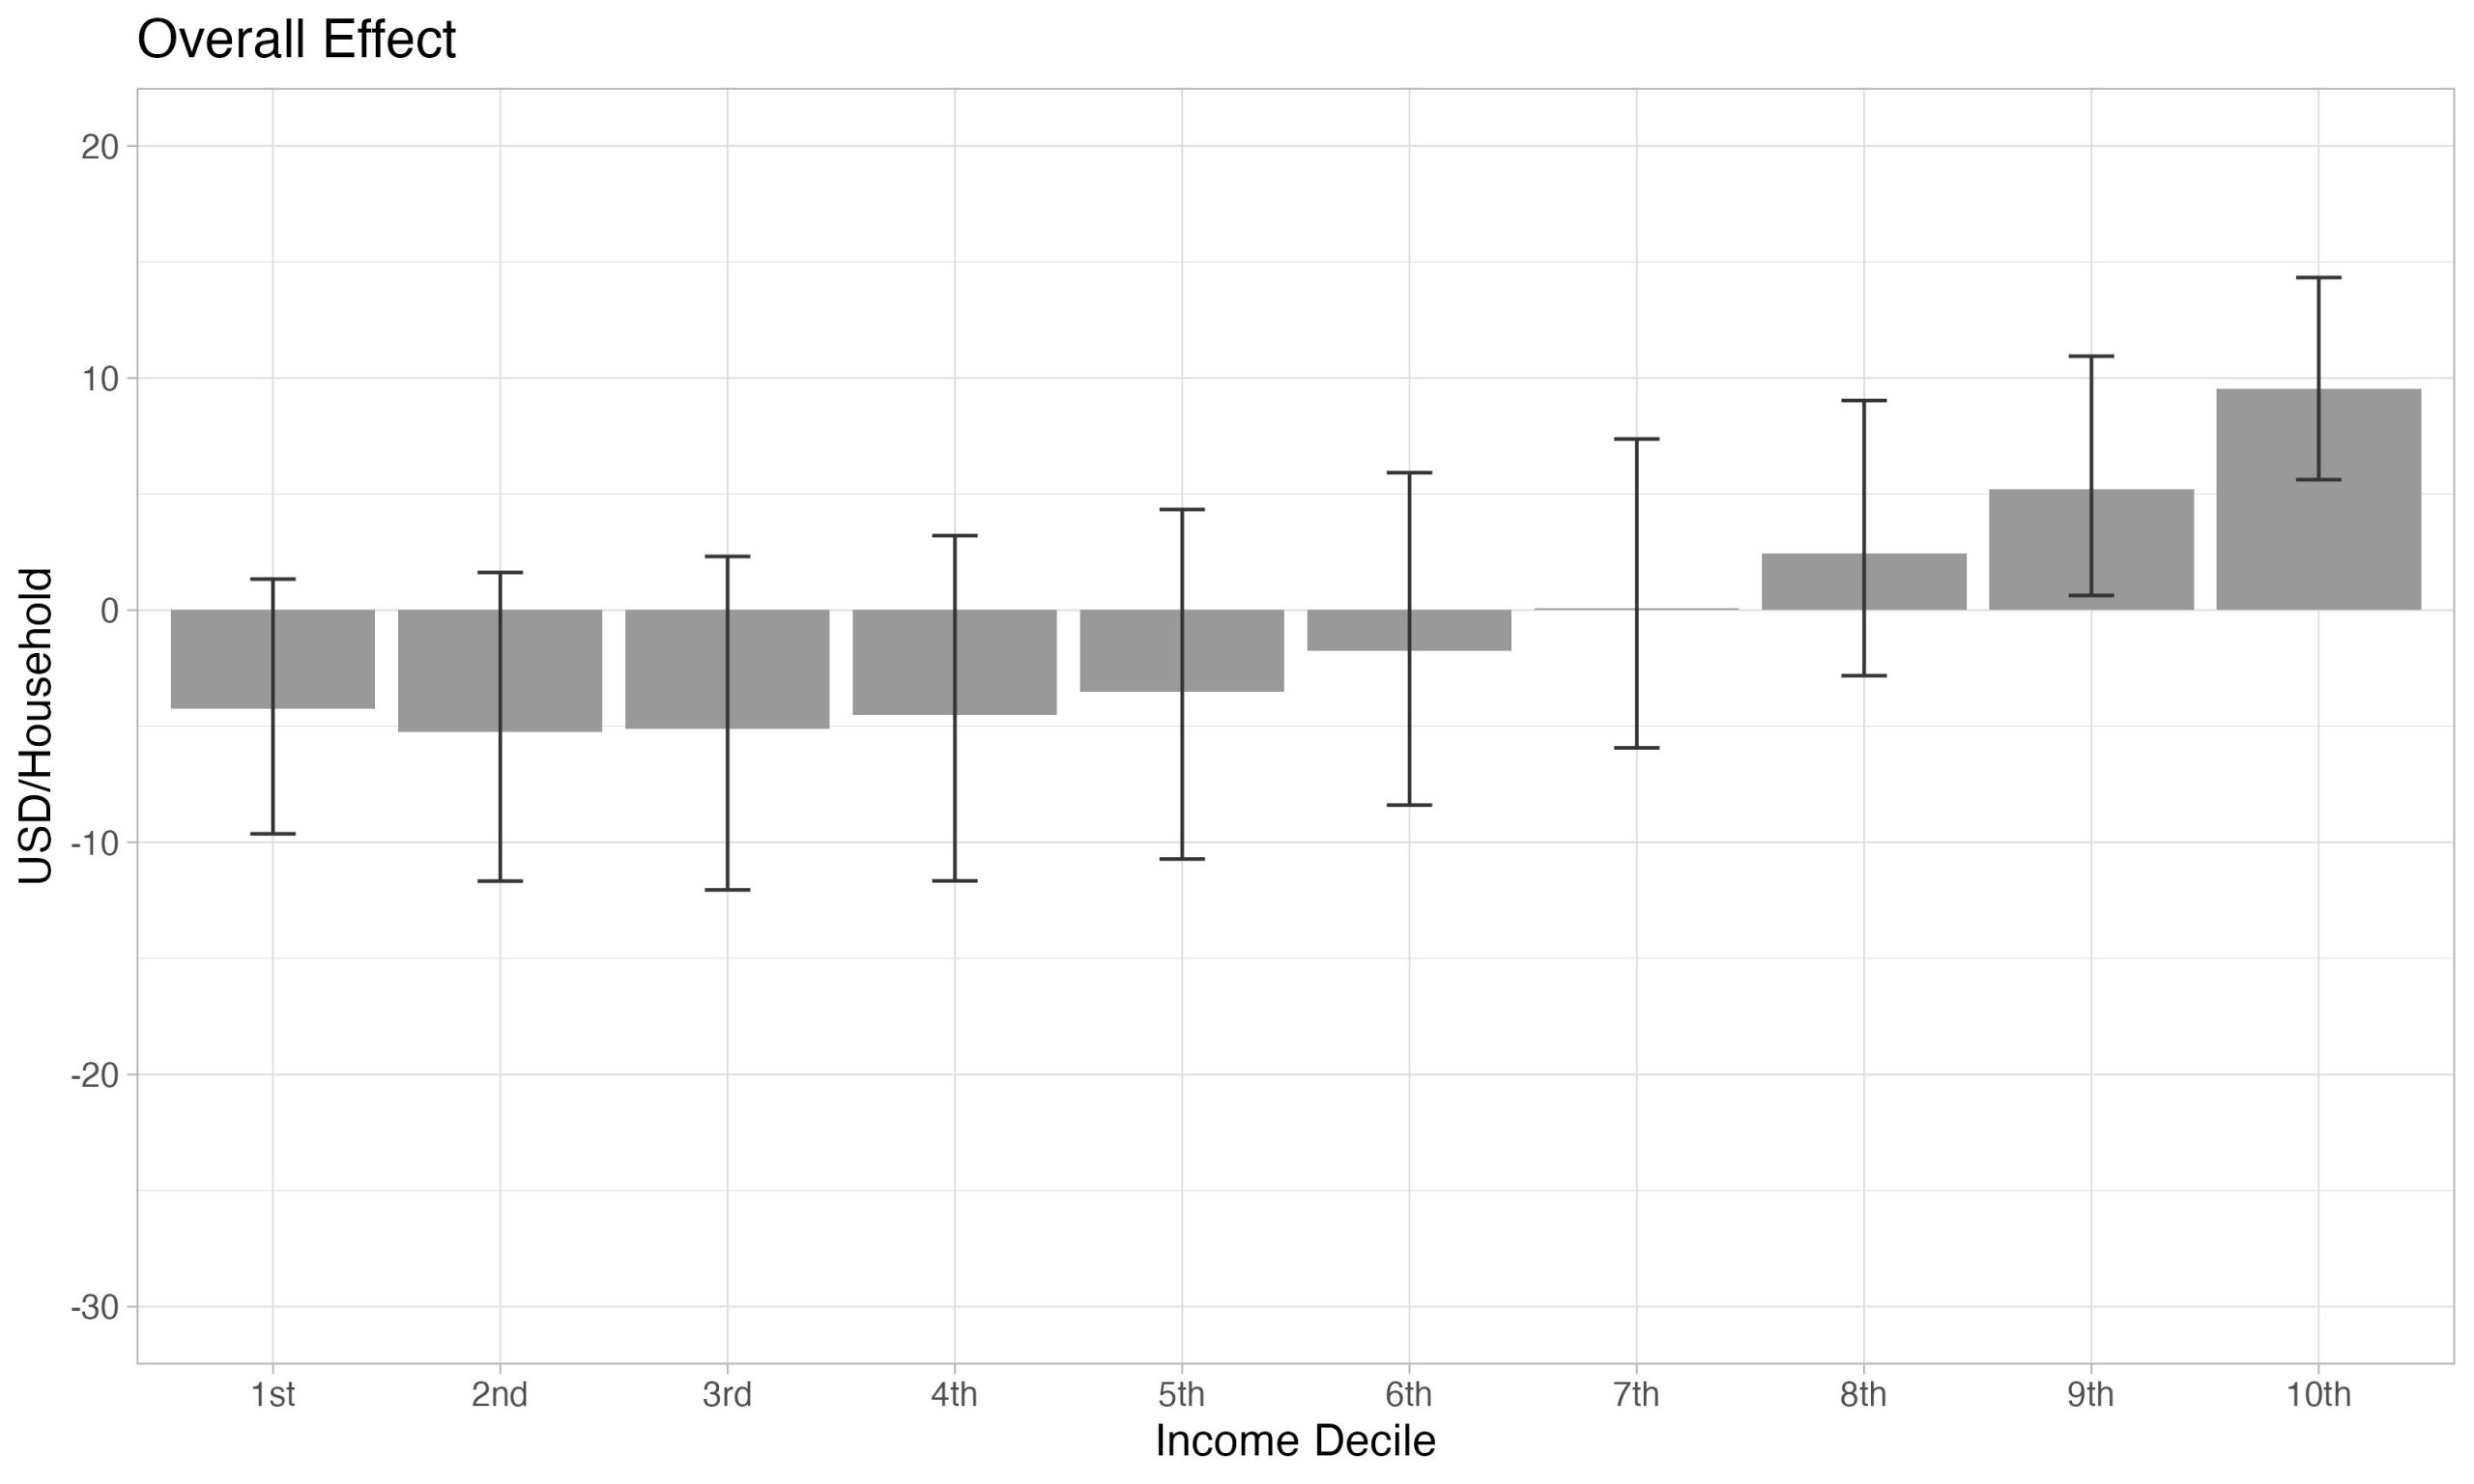
Figure 1: Change in Tax Payments by Income Decile
Our disaggregated analysis finds striking disparities emerge across geography, as seen in Figure 2. Rural areas and the center of the United States, which tend to experience lower average fuel efficiency, experience substantial benefits from a revenue-neutral VMT-Gas Tax swap. This effect is closely tied to the uneven geographic distribution of EV adoption: urban areas and coastal regions, where EV penetration is highest, are less reliant on the gas tax and benefit less from a shift to VMT-based taxation.
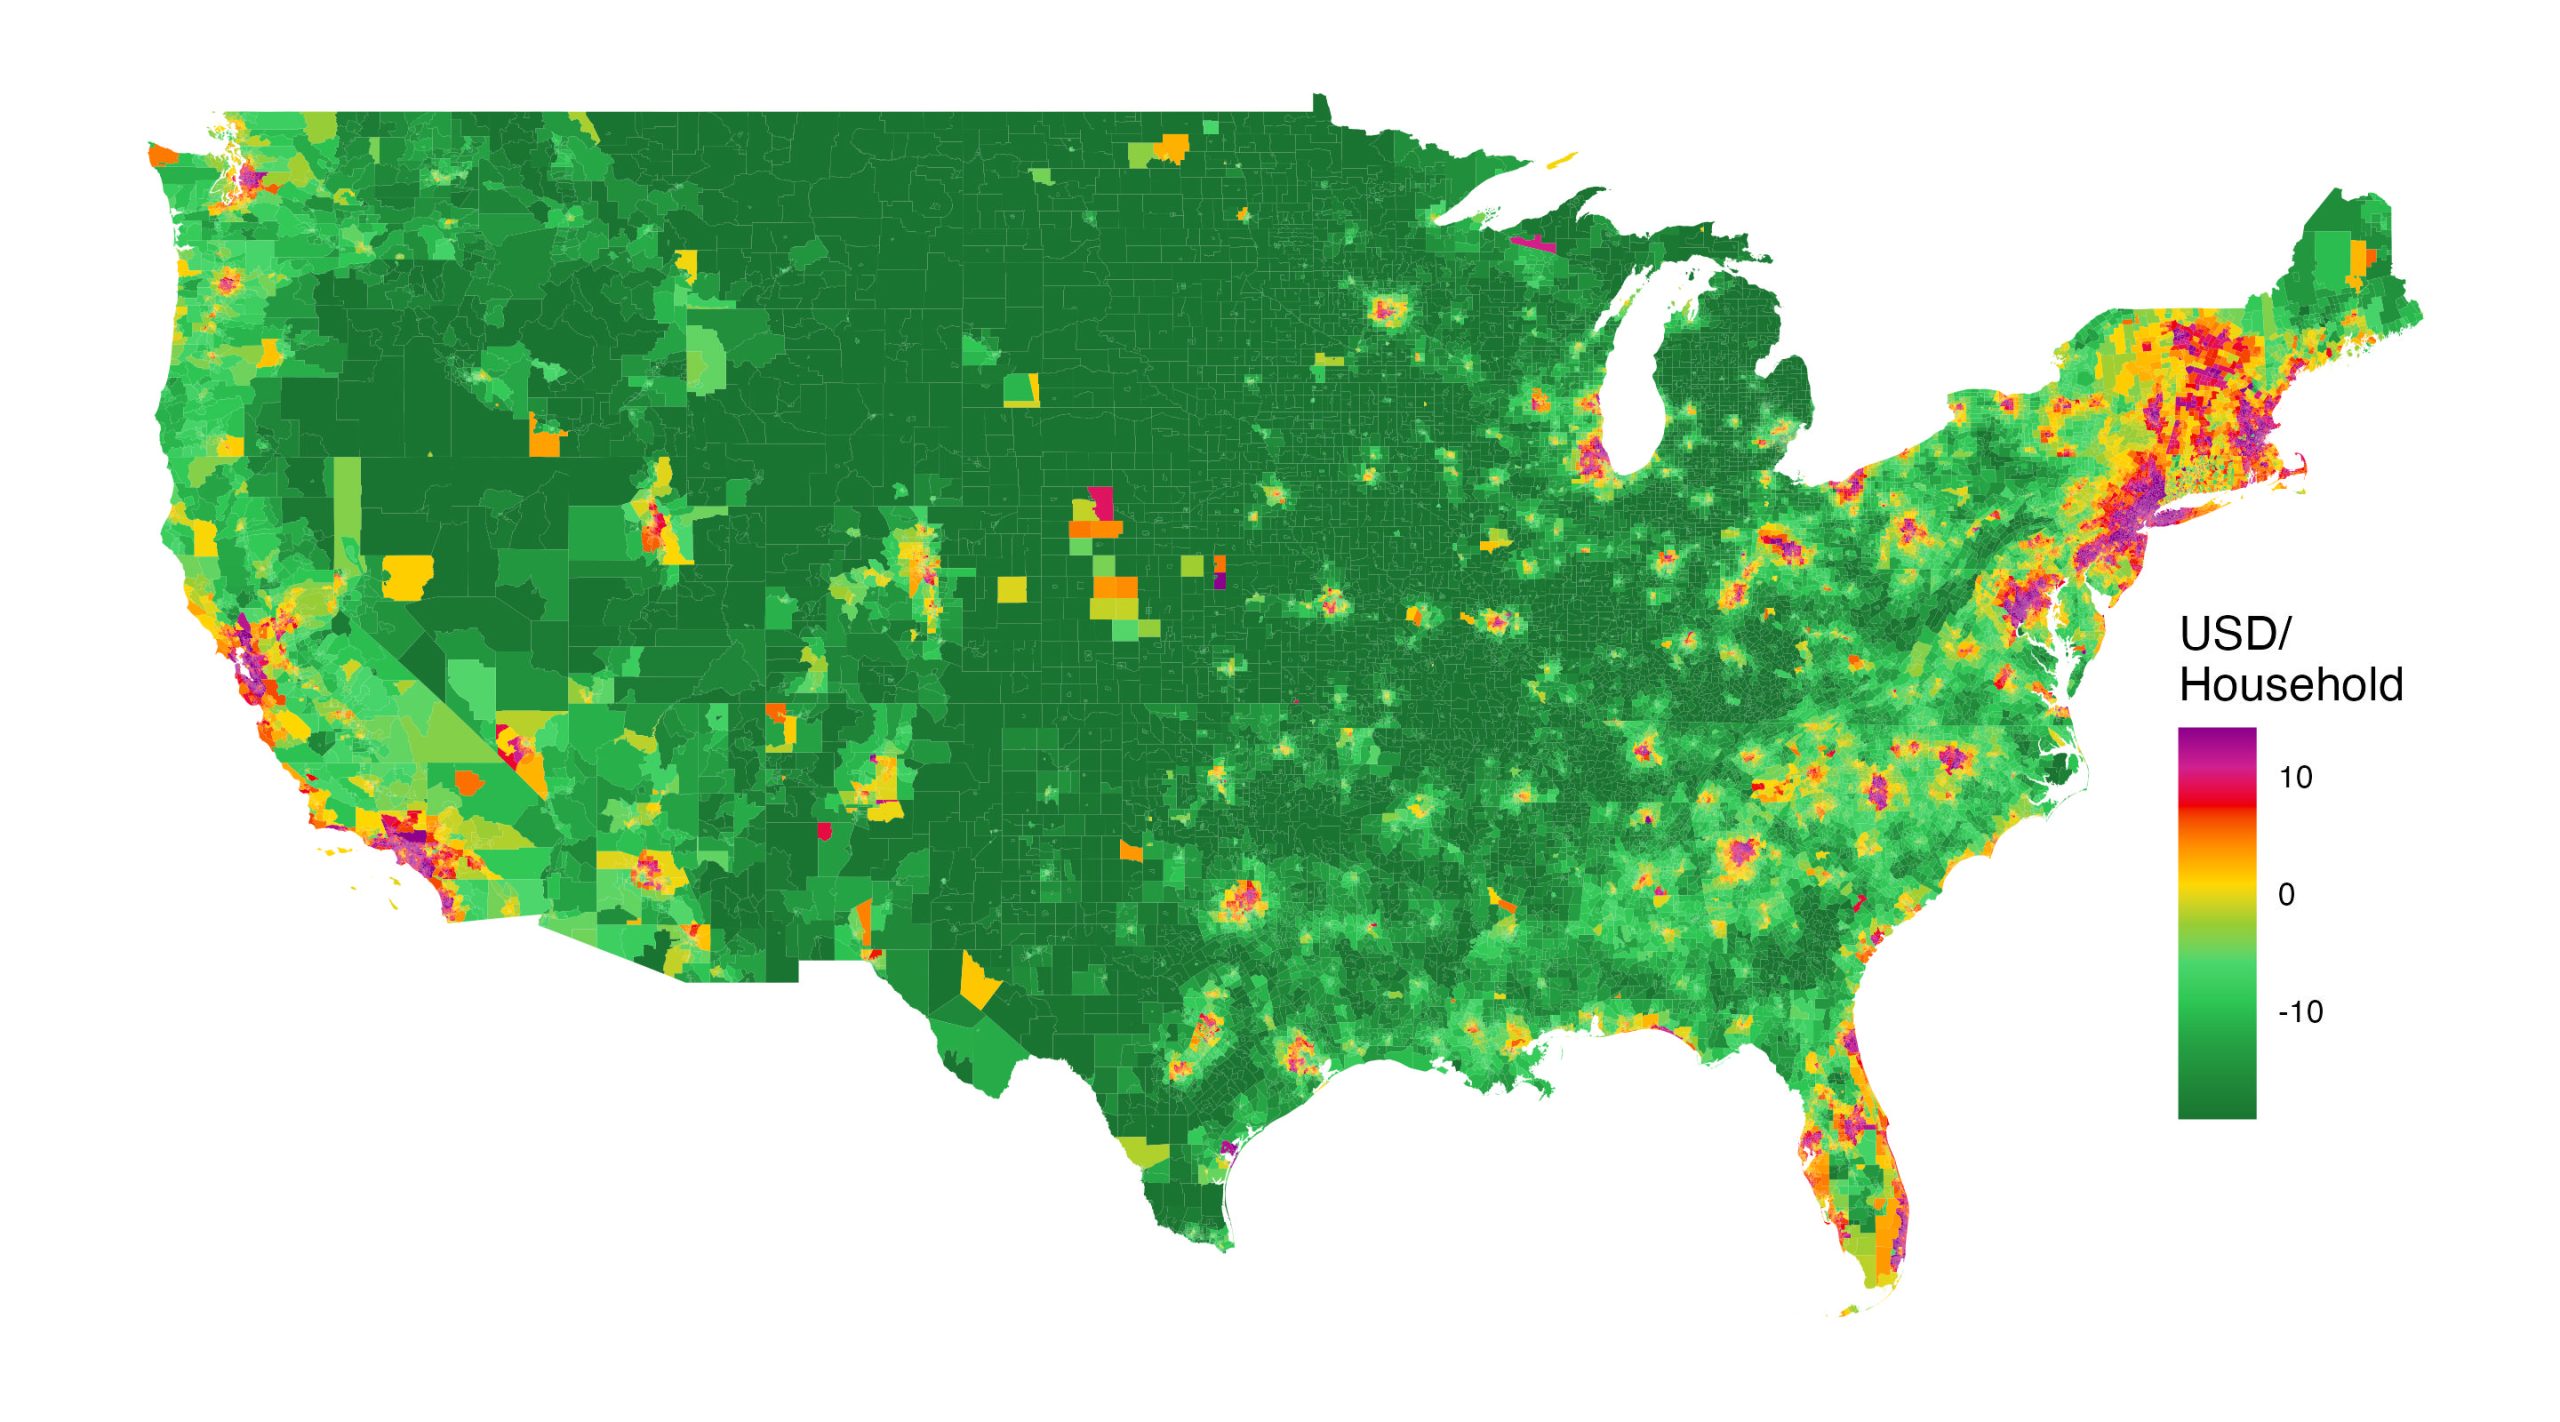
Figure 2: Changes in Tax Collections from Gas-VMT Swap.
Note: Census tract average data are winsorized at 95%.
Additionally, Figure 3 shows Republican-leaning districts, which overlap significantly with rural areas, see marked advantages compared to Democratic districts. The results highlight the potential for a VMT tax to address longstanding inequities in transportation funding while offering a politically salient narrative. By documenting the geographic and political implications of this policy shift, this study contributes to the broader debate on how to design equitable and effective transportation taxation systems in a rapidly evolving mobility landscape.
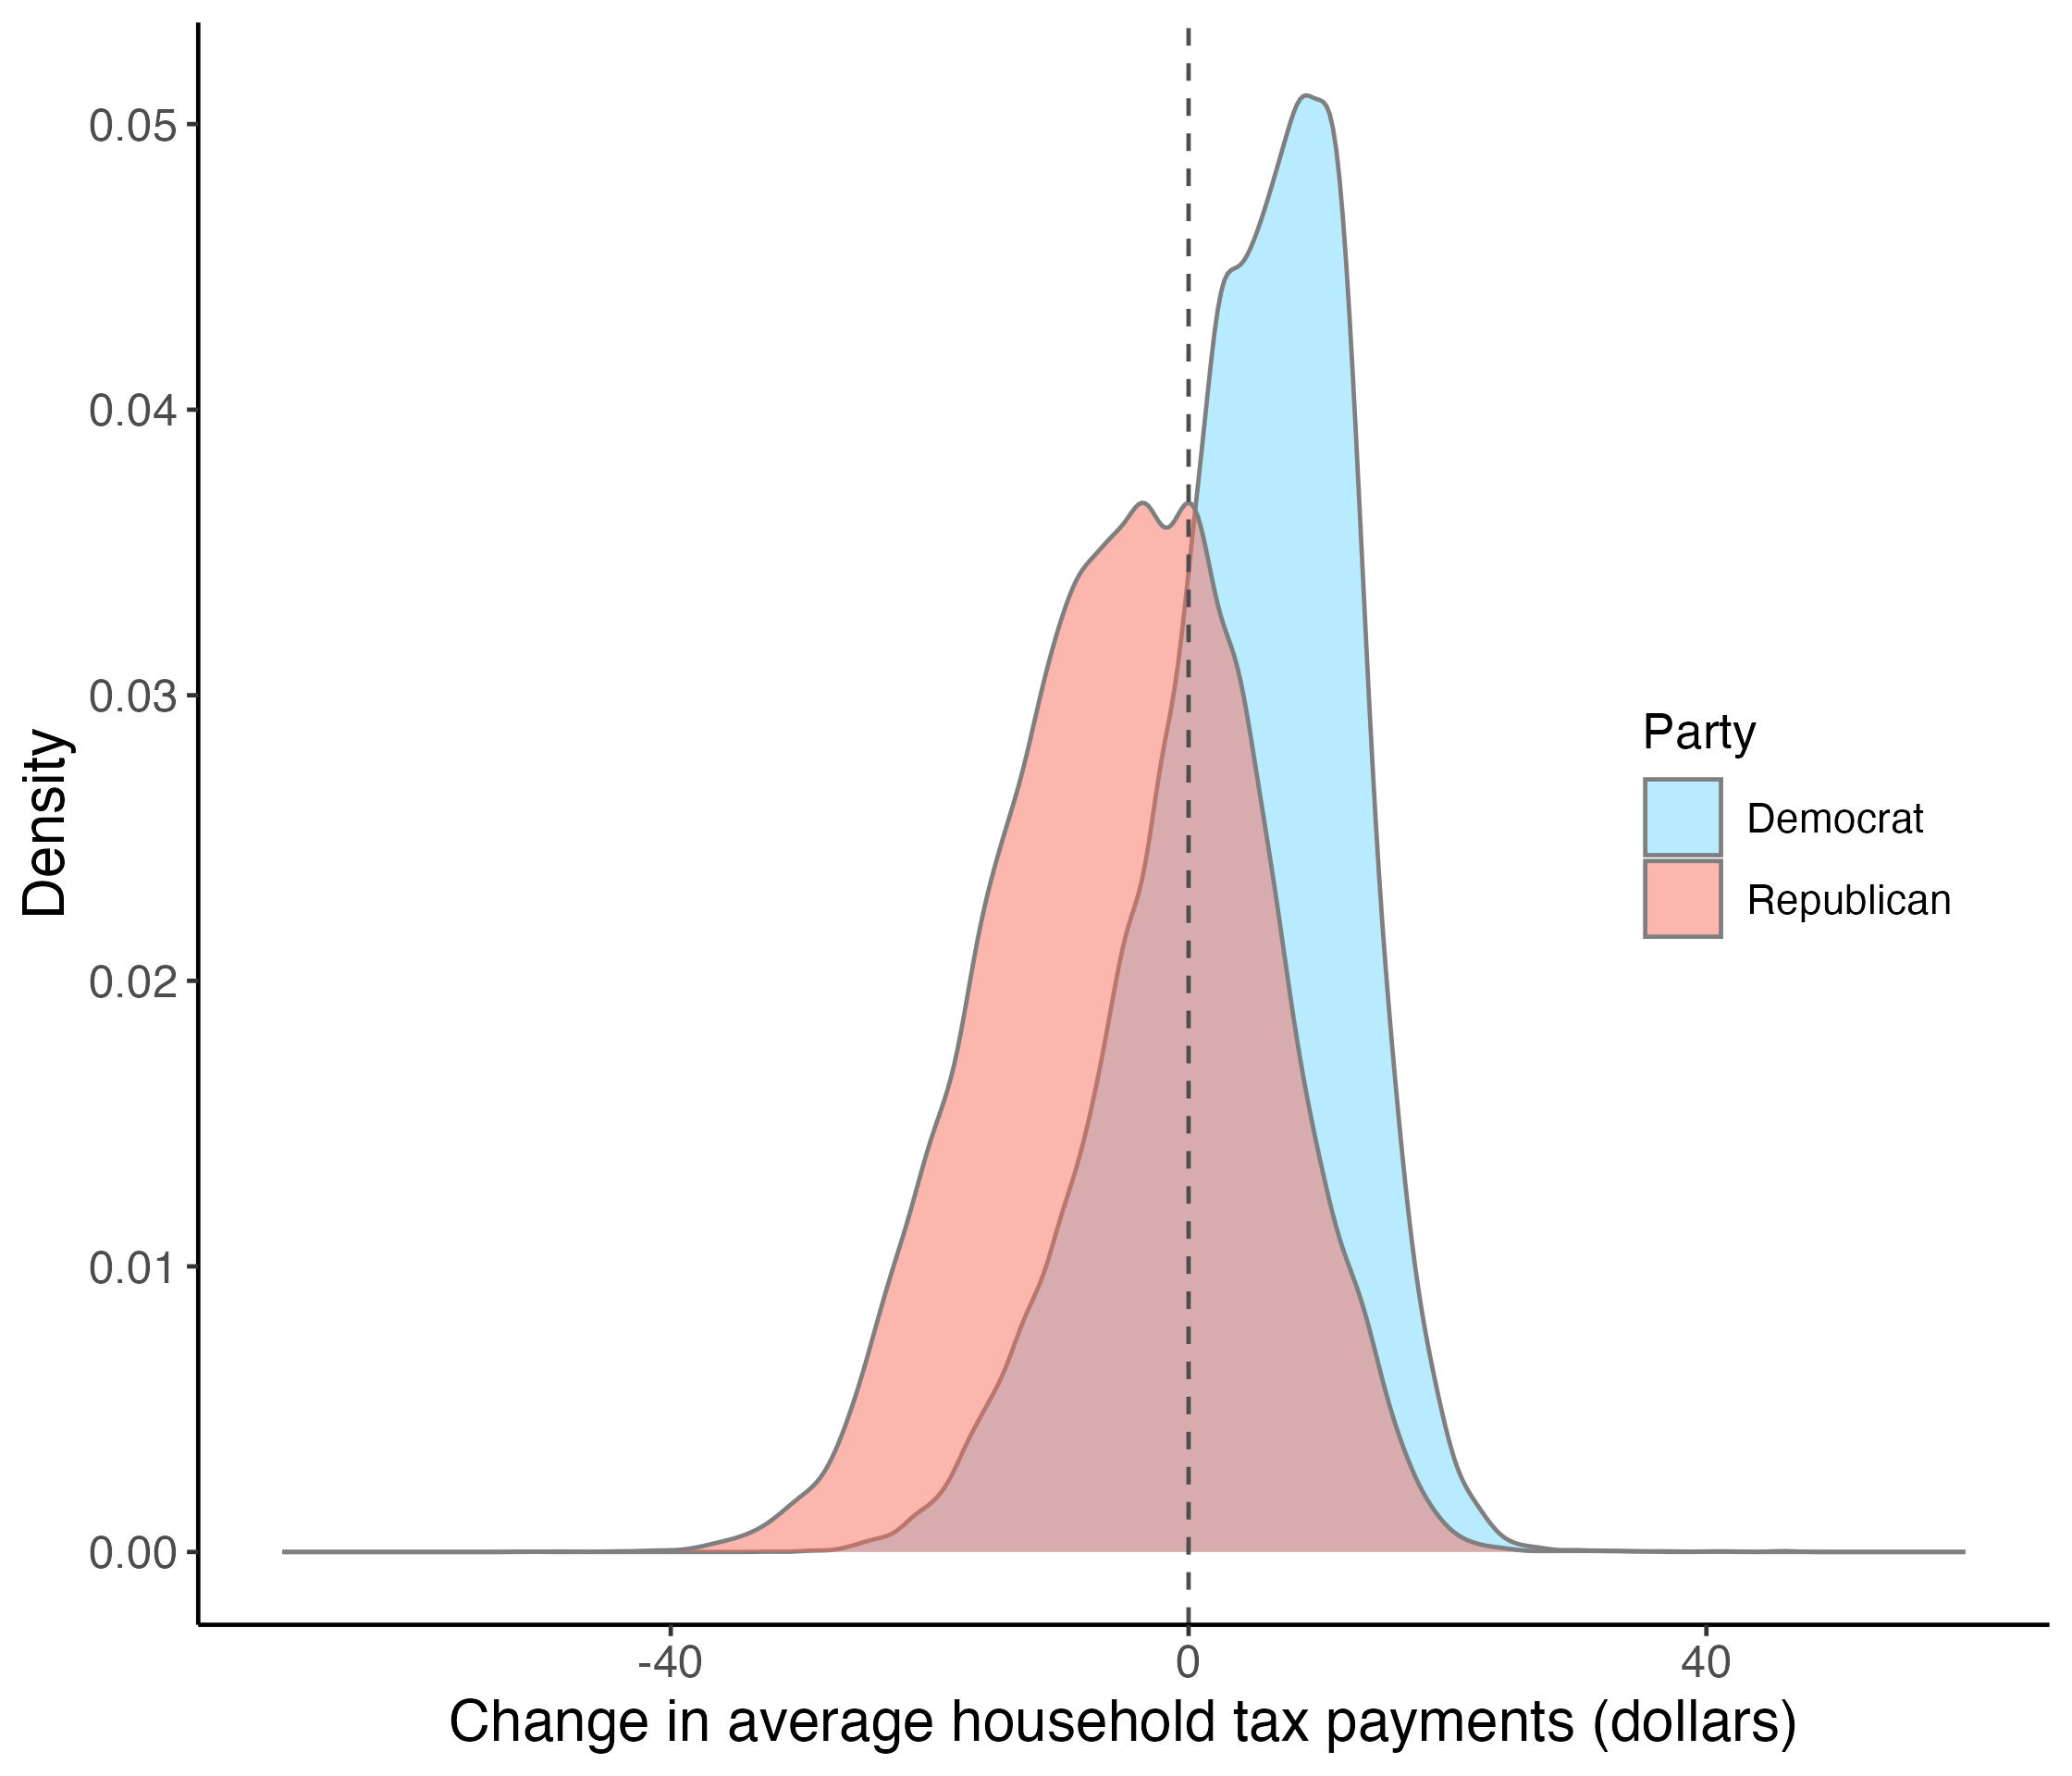
Figure 3: Change in Tax Collections from Gas-VMT Tax Swap by Political Party Affiliation.
Note: Party affiliation based on affiliation of the House Members in the 118th Congress.
Our focus here has been on the distributional implications of a tax swap to address the ongoing erosion of the tax base of the motor vehicle fuel excise tax. We should emphasize that we have not made a case on theoretical grounds for efficiency improvements from such a tax swap. Whether we should think of the gas (or VMT) tax as a benefit tax or as an externality-correcting tax, there are a number of factors to take into consideration. A benefits perspective argues for a VMT tax on the grounds that those using roads should bear the cost of their upkeep (as financed through the Highway Trust Fund). But this begs the question of the appropriate sharing of costs between personal and commercial transportation, and especially long-haul trucking in the latter category. From an externalities perspective, considerations of local pollution, road wear, congestion, and accidents all come into play. Innovation and network failures that impede the penetration of electric vehicles are also a consideration. An ideal set of policies likely combines a VMT tax with a subsidy for EVs to address pollution, innovation, and network failures.